
 Yahoo Finance
 Exco Technologies (TSE:XTC) May Have Issues Allocating Its Capital
What are the early trends we should look for to identify a stock that could multiply in value over the long term? Firstly, we'll want to see a proven return on capital employed (ROCE) that is increasing, and secondly, an expanding base of capital employed. This shows us that it's a compounding machine, able to continually reinvest its earnings back into the business and generate higher returns. Having said that, from a first glance at Exco Technologies (TSE:XTC) we aren't jumping out of our chairs at how returns are trending, but let's have a deeper look.
Return On Capital Employed (ROCE): What Is It?
For those that aren't sure what ROCE is, it measures the amount of pre-tax profits a company can generate from the capital employed in its business. Analysts use this formula to calculate it for Exco Technologies:
Return on Capital Employed = Earnings Before Interest and Tax (EBIT) ÷ (Total Assets - Current Liabilities)
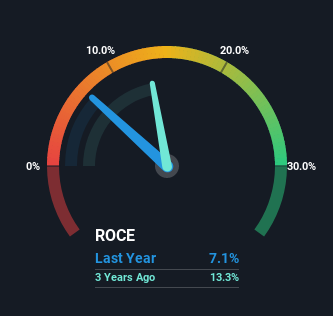
0.071 = CA$30m ÷ (CA$540m - CA$108m) (Based on the trailing twelve months to June 2022).
Therefore, Exco Technologies has an ROCE of 7.1%. In absolute terms, that's a low return but it's around the Auto Components industry average of 8.6%.
Check out our latest analysis for Exco Technologies
In the above chart we have measured Exco Technologies' prior ROCE against its prior performance, but the future is arguably more important. If you'd like to see what analysts are forecasting going forward, you should check out our free report for Exco Technologies.
How Are Returns Trending?
When we looked at the ROCE trend at Exco Technologies, we didn't gain much confidence. To be more specific, ROCE has fallen from 20% over the last five years. On the other hand, the company has been employing more capital without a corresponding improvement in sales in the last year, which could suggest these investments are longer term plays. It may take some time before the company starts to see any change in earnings from these investments.
The Bottom Line
In summary, Exco Technologies is reinvesting funds back into the business for growth but unfortunately it looks like sales haven't increased much just yet. Since the stock has declined 16% over the last five years, investors may not be too optimistic on this trend improving either. On the whole, we aren't too inspired by the underlying trends and we think there may be better chances of finding a multi-bagger elsewhere.
One more thing to note, we've identified 2 warning signs with Exco Technologies and understanding these should be part of your investment process.
For those who like to invest in solid companies, check out this free list of companies with solid balance sheets and high returns on equity.
Have feedback on this article? Concerned about the content? Get in touch with us directly. Alternatively, email editorial-team (at) simplywallst.com.
This article by Simply Wall St is general in nature. We provide commentary based on historical data and analyst forecasts only using an unbiased methodology and our articles are not intended to be financial advice. It does not constitute a recommendation to buy or sell any stock, and does not take account of your objectives, or your financial situation. We aim to bring you long-term focused analysis driven by fundamental data. Note that our analysis may not factor in the latest price-sensitive company announcements or qualitative material. Simply Wall St has no position in any stocks mentioned.
Join A Paid User Research Session
You’ll receive a US$30 Amazon Gift card for 1 hour of your time while helping us build better investing tools for the individual investors like yourself. Sign up here
