
 Yahoo Finance
 exceet Group (ETR:EXC) Shareholders Received A Total Return Of 20% In The Last Year

It's understandable if you feel frustrated when a stock you own sees a lower share price. But often it is not a reflection of the fundamental business performance. The exceet Group SCA (ETR:EXC) is down 32% over a year, but the total shareholder return is 20% once you include the dividend. And that total return actually beats the market decline of 11%. On the bright side, the stock is actually up 6.2% in the last three years. Furthermore, it's down 13% in about a quarter. That's not much fun for holders. But this could be related to the weak market, which is down 19% in the same period.
View our latest analysis for exceet Group
To paraphrase Benjamin Graham: Over the short term the market is a voting machine, but over the long term it's a weighing machine. One imperfect but simple way to consider how the market perception of a company has shifted is to compare the change in the earnings per share (EPS) with the share price movement.
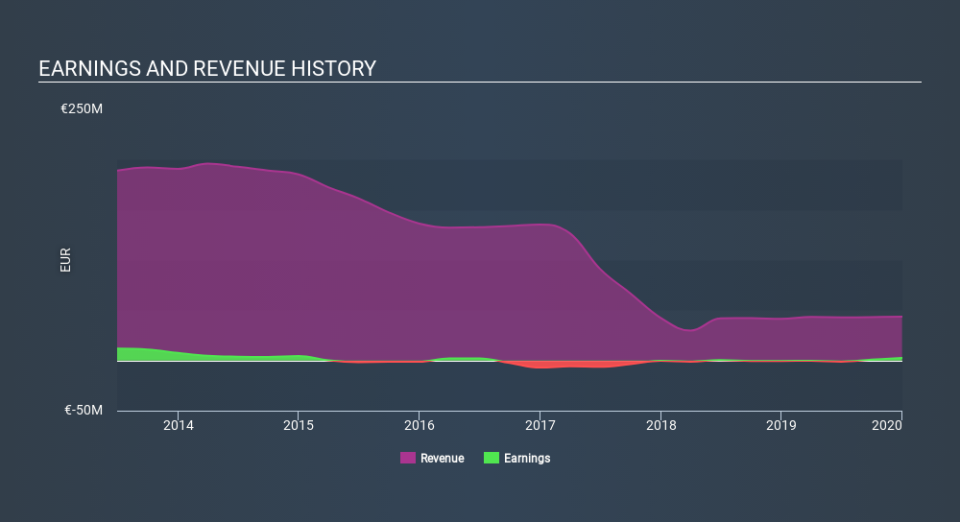
exceet Group managed to increase earnings per share from a loss to a profit, over the last 12 months.
Earnings per share growth rates aren't particularly useful for comparing with the share price, when a company has moved from loss to profit. But we may find different metrics more enlightening.
exceet Group managed to grow revenue over the last year, which is usually a real positive. Since the fundamental metrics don't readily explain the share price drop, there might be an opportunity if the market has overreacted.
You can see below how earnings and revenue have changed over time (discover the exact values by clicking on the image).
It is of course excellent to see how exceet Group has grown profits over the years, but the future is more important for shareholders. It might be well worthwhile taking a look at our free report on how its financial position has changed over time.
What about the Total Shareholder Return (TSR)?
Investors should note that there's a difference between exceet Group's total shareholder return (TSR) and its share price change, which we've covered above. The TSR attempts to capture the value of dividends (as if they were reinvested) as well as any spin-offs or discounted capital raisings offered to shareholders. We note that exceet Group's TSR, at 20% is higher than its share price return of -32%. When you consider it hasn't been paying a dividend, this data suggests shareholders have benefitted from a spin-off, or had the opportunity to acquire attractively priced shares in a discounted capital raising.
A Different Perspective
We're pleased to report that exceet Group shareholders have received a total shareholder return of 20% over one year. That's better than the annualised return of 8.2% over half a decade, implying that the company is doing better recently. Given the share price momentum remains strong, it might be worth taking a closer look at the stock, lest you miss an opportunity. It's always interesting to track share price performance over the longer term. But to understand exceet Group better, we need to consider many other factors. Like risks, for instance. Every company has them, and we've spotted 2 warning signs for exceet Group (of which 1 is significant!) you should know about.
If you like to buy stocks alongside management, then you might just love this free list of companies. (Hint: insiders have been buying them).
Please note, the market returns quoted in this article reflect the market weighted average returns of stocks that currently trade on DE exchanges.
If you spot an error that warrants correction, please contact the editor at editorial-team@simplywallst.com. This article by Simply Wall St is general in nature. It does not constitute a recommendation to buy or sell any stock, and does not take account of your objectives, or your financial situation. Simply Wall St has no position in the stocks mentioned.
We aim to bring you long-term focused research analysis driven by fundamental data. Note that our analysis may not factor in the latest price-sensitive company announcements or qualitative material. Thank you for reading.
