
 Yahoo Finance
 Is Evrim Resources Corp.'s (CVE:EVM) CEO Overpaid Relative To Its Peers?

In 2010 Paddy Nicol was appointed CEO of Evrim Resources Corp. (CVE:EVM). This analysis aims first to contrast CEO compensation with other companies that have similar market capitalization. Then we'll look at a snap shot of the business growth. Third, we'll reflect on the total return to shareholders over three years, as a second measure of business performance. This method should give us information to assess how appropriately the company pays the CEO.
See our latest analysis for Evrim Resources
How Does Paddy Nicol's Compensation Compare With Similar Sized Companies?
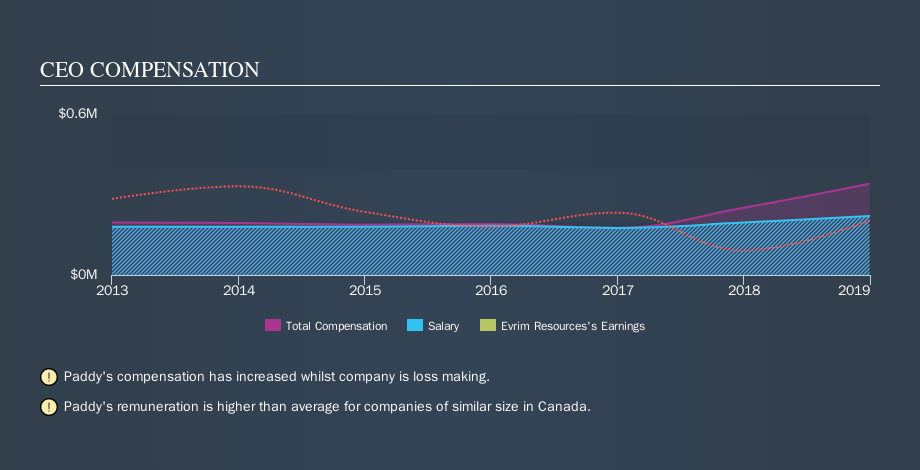
At the time of writing, our data says that Evrim Resources Corp. has a market cap of CA$26m, and reported total annual CEO compensation of CA$340k for the year to December 2018. While we always look at total compensation first, we note that the salary component is less, at CA$220k. We examined a group of similar sized companies, with market capitalizations of below CA$264m. The median CEO total compensation in that group is CA$180k.
Thus we can conclude that Paddy Nicol receives more in total compensation than the median of a group of companies in the same market, and of similar size to Evrim Resources Corp.. However, this doesn't necessarily mean the pay is too high. We can get a better idea of how generous the pay is by looking at the performance of the underlying business.
The graphic below shows how CEO compensation at Evrim Resources has changed from year to year.
Is Evrim Resources Corp. Growing?
On average over the last three years, Evrim Resources Corp. has grown earnings per share (EPS) by 9.6% each year (using a line of best fit). In the last year, its revenue is up 133%.
It's great to see that revenue growth is strong. Combined with modest EPS growth, we get a good impression of the company. I wouldn't say this is necessarily top notch growth, but it is certainly promising. Although we don't have analyst forecasts shareholders might want to examine this detailed historical graph of earnings, revenue and cash flow.
Has Evrim Resources Corp. Been A Good Investment?
Evrim Resources Corp. has generated a total shareholder return of 24% over three years, so most shareholders would be reasonably content. But they probably wouldn't be so happy as to think the CEO should be paid more than is normal, for companies around this size.
In Summary...
We compared the total CEO remuneration paid by Evrim Resources Corp., and compared it to remuneration at a group of similar sized companies. We found that it pays well over the median amount paid in the benchmark group.
We generally prefer to see stronger EPS growth, and we're not particularly impressed with the total shareholder return, over the last three years. So it's certainly hard to argue that the CEO is modestly paid, although we don't see the remuneration as an issue. If you think CEO compensation levels are interesting you will probably really like this free visualization of insider trading at Evrim Resources.
Arguably, business quality is much more important than CEO compensation levels. So check out this free list of interesting companies, that have HIGH return on equity and low debt.
We aim to bring you long-term focused research analysis driven by fundamental data. Note that our analysis may not factor in the latest price-sensitive company announcements or qualitative material.
If you spot an error that warrants correction, please contact the editor at editorial-team@simplywallst.com. This article by Simply Wall St is general in nature. It does not constitute a recommendation to buy or sell any stock, and does not take account of your objectives, or your financial situation. Simply Wall St has no position in the stocks mentioned. Thank you for reading.
