
 Yahoo Finance
 Even though Workday (NASDAQ:WDAY) has lost US$2.8b market cap in last 7 days, shareholders are still up 60% over 5 years
When we invest, we're generally looking for stocks that outperform the market average. And while active stock picking involves risks (and requires diversification) it can also provide excess returns. For example, the Workday, Inc. (NASDAQ:WDAY) share price is up 60% in the last 5 years, clearly besting the market return of around 46% (ignoring dividends). On the other hand, the more recent gains haven't been so impressive, with shareholders gaining just 33%.
In light of the stock dropping 5.0% in the past week, we want to investigate the longer term story, and see if fundamentals have been the driver of the company's positive five-year return.
Check out our latest analysis for Workday
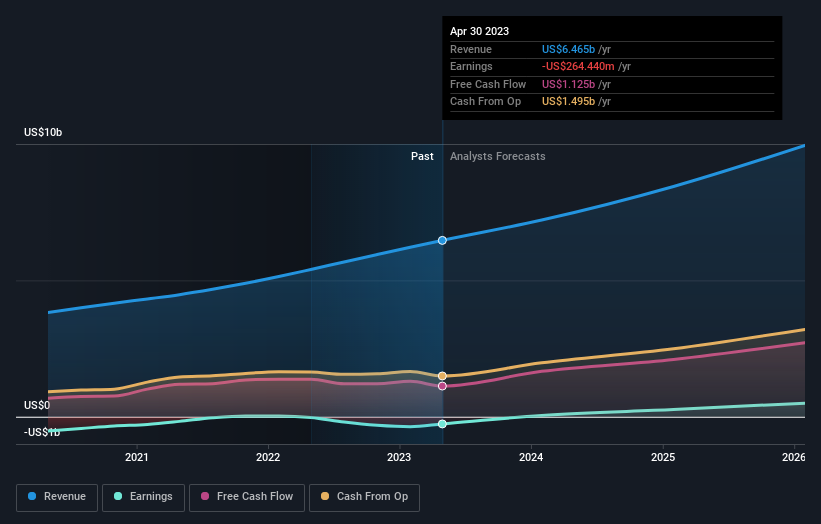
Workday wasn't profitable in the last twelve months, it is unlikely we'll see a strong correlation between its share price and its earnings per share (EPS). Arguably revenue is our next best option. When a company doesn't make profits, we'd generally expect to see good revenue growth. That's because fast revenue growth can be easily extrapolated to forecast profits, often of considerable size.
For the last half decade, Workday can boast revenue growth at a rate of 19% per year. That's well above most pre-profit companies. While the compound gain of 10% per year is good, it's not unreasonable given the strong revenue growth. If you think there could be more growth to come, now might be the time to take a close look at Workday. Opportunity lies where the market hasn't fully priced growth in the underlying business.
The graphic below depicts how earnings and revenue have changed over time (unveil the exact values by clicking on the image).
Workday is a well known stock, with plenty of analyst coverage, suggesting some visibility into future growth. Given we have quite a good number of analyst forecasts, it might be well worth checking out this free chart depicting consensus estimates.
A Different Perspective
It's nice to see that Workday shareholders have received a total shareholder return of 33% over the last year. That's better than the annualised return of 10% over half a decade, implying that the company is doing better recently. In the best case scenario, this may hint at some real business momentum, implying that now could be a great time to delve deeper. It's always interesting to track share price performance over the longer term. But to understand Workday better, we need to consider many other factors. Consider risks, for instance. Every company has them, and we've spotted 2 warning signs for Workday you should know about.
We will like Workday better if we see some big insider buys. While we wait, check out this free list of growing companies with considerable, recent, insider buying.
Please note, the market returns quoted in this article reflect the market weighted average returns of stocks that currently trade on American exchanges.
Have feedback on this article? Concerned about the content? Get in touch with us directly. Alternatively, email editorial-team (at) simplywallst.com.
This article by Simply Wall St is general in nature. We provide commentary based on historical data and analyst forecasts only using an unbiased methodology and our articles are not intended to be financial advice. It does not constitute a recommendation to buy or sell any stock, and does not take account of your objectives, or your financial situation. We aim to bring you long-term focused analysis driven by fundamental data. Note that our analysis may not factor in the latest price-sensitive company announcements or qualitative material. Simply Wall St has no position in any stocks mentioned.
Join A Paid User Research Session
You’ll receive a US$30 Amazon Gift card for 1 hour of your time while helping us build better investing tools for the individual investors like yourself. Sign up here
