
 Yahoo Finance
 Even though CarParts.com (NASDAQ:PRTS) has lost US$56m market cap in last 7 days, shareholders are still up 245% over 3 years
The CarParts.com, Inc. (NASDAQ:PRTS) share price is down a rather concerning 30% in the last month. But that doesn't change the fact that the returns over the last three years have been very strong. In three years the stock price has launched 245% higher: a great result. After a run like that some may not be surprised to see prices moderate. Only time will tell if there is still too much optimism currently reflected in the share price.
While the stock has fallen 15% this week, it's worth focusing on the longer term and seeing if the stocks historical returns have been driven by the underlying fundamentals.
View our latest analysis for CarParts.com
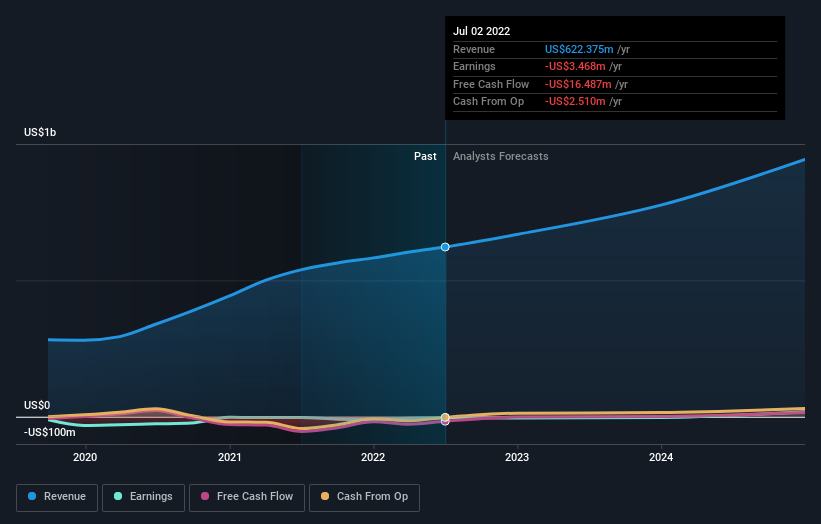
Given that CarParts.com didn't make a profit in the last twelve months, we'll focus on revenue growth to form a quick view of its business development. When a company doesn't make profits, we'd generally expect to see good revenue growth. Some companies are willing to postpone profitability to grow revenue faster, but in that case one does expect good top-line growth.
In the last 3 years CarParts.com saw its revenue grow at 31% per year. That's much better than most loss-making companies. Meanwhile, the share price performance has been pretty solid at 51% compound over three years. But it does seem like the market is paying attention to strong revenue growth. Nonetheless, we'd say CarParts.com is still worth investigating - successful businesses can often keep growing for long periods.
The graphic below depicts how earnings and revenue have changed over time (unveil the exact values by clicking on the image).
This free interactive report on CarParts.com's balance sheet strength is a great place to start, if you want to investigate the stock further.
A Different Perspective
While the broader market lost about 17% in the twelve months, CarParts.com shareholders did even worse, losing 65%. However, it could simply be that the share price has been impacted by broader market jitters. It might be worth keeping an eye on the fundamentals, in case there's a good opportunity. Longer term investors wouldn't be so upset, since they would have made 15%, each year, over five years. If the fundamental data continues to indicate long term sustainable growth, the current sell-off could be an opportunity worth considering. I find it very interesting to look at share price over the long term as a proxy for business performance. But to truly gain insight, we need to consider other information, too. To that end, you should be aware of the 2 warning signs we've spotted with CarParts.com .
Of course CarParts.com may not be the best stock to buy. So you may wish to see this free collection of growth stocks.
Please note, the market returns quoted in this article reflect the market weighted average returns of stocks that currently trade on US exchanges.
Have feedback on this article? Concerned about the content? Get in touch with us directly. Alternatively, email editorial-team (at) simplywallst.com.
This article by Simply Wall St is general in nature. We provide commentary based on historical data and analyst forecasts only using an unbiased methodology and our articles are not intended to be financial advice. It does not constitute a recommendation to buy or sell any stock, and does not take account of your objectives, or your financial situation. We aim to bring you long-term focused analysis driven by fundamental data. Note that our analysis may not factor in the latest price-sensitive company announcements or qualitative material. Simply Wall St has no position in any stocks mentioned.
Join A Paid User Research Session
You’ll receive a US$30 Amazon Gift card for 1 hour of your time while helping us build better investing tools for the individual investors like yourself. Sign up here
