
 Yahoo Finance
 Even after rising 50% this past week, SAI.TECH Global (NASDAQ:SAI) shareholders are still down 53% over the past year
SAI.TECH Global Corporation (NASDAQ:SAI) shareholders will doubtless be very grateful to see the share price up 72% in the last month. But that's small comfort given the dismal price performance over the last year. Specifically, the stock price slipped by 53% in that time. The share price recovery is not so impressive when you consider the fall. You could argue that the sell-off was too severe.
The recent uptick of 50% could be a positive sign of things to come, so let's take a look at historical fundamentals.
See our latest analysis for SAI.TECH Global
SAI.TECH Global isn't currently profitable, so most analysts would look to revenue growth to get an idea of how fast the underlying business is growing. When a company doesn't make profits, we'd generally expect to see good revenue growth. Some companies are willing to postpone profitability to grow revenue faster, but in that case one does expect good top-line growth.
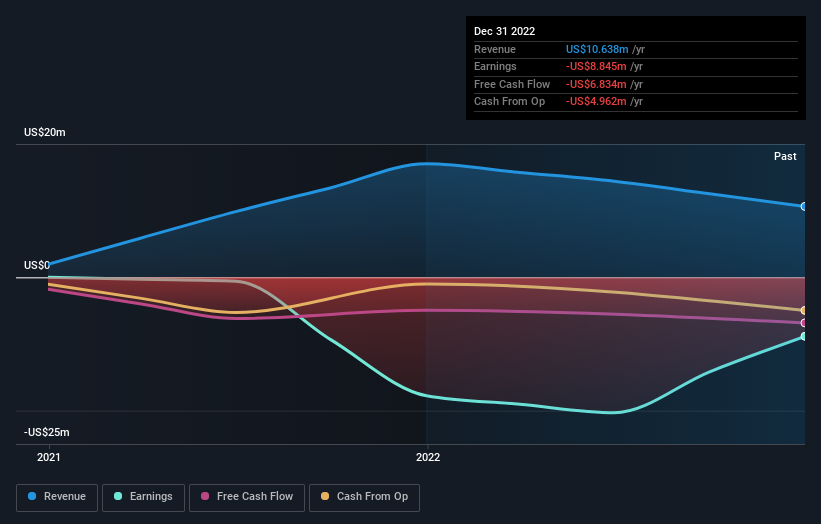
SAI.TECH Global's revenue didn't grow at all in the last year. In fact, it fell 38%. That's not what investors generally want to see. In the absence of profits, it's not unreasonable that the share price fell 53%. Fingers crossed this is the low ebb for the stock. We don't generally like to own companies with falling revenues and no profits, so we're pretty cautious of this one, at the moment.
You can see how earnings and revenue have changed over time in the image below (click on the chart to see the exact values).
You can see how its balance sheet has strengthened (or weakened) over time in this free interactive graphic.
A Different Perspective
While SAI.TECH Global shareholders are down 53% for the year, the market itself is up 16%. However, keep in mind that even the best stocks will sometimes underperform the market over a twelve month period. With the stock down 47% over the last three months, the market doesn't seem to believe that the company has solved all its problems. Given the relatively short history of this stock, we'd remain pretty wary until we see some strong business performance. I find it very interesting to look at share price over the long term as a proxy for business performance. But to truly gain insight, we need to consider other information, too. To that end, you should learn about the 3 warning signs we've spotted with SAI.TECH Global (including 2 which are significant) .
For those who like to find winning investments this free list of growing companies with recent insider purchasing, could be just the ticket.
Please note, the market returns quoted in this article reflect the market weighted average returns of stocks that currently trade on American exchanges.
Have feedback on this article? Concerned about the content? Get in touch with us directly. Alternatively, email editorial-team (at) simplywallst.com.
This article by Simply Wall St is general in nature. We provide commentary based on historical data and analyst forecasts only using an unbiased methodology and our articles are not intended to be financial advice. It does not constitute a recommendation to buy or sell any stock, and does not take account of your objectives, or your financial situation. We aim to bring you long-term focused analysis driven by fundamental data. Note that our analysis may not factor in the latest price-sensitive company announcements or qualitative material. Simply Wall St has no position in any stocks mentioned.
Join A Paid User Research Session
You’ll receive a US$30 Amazon Gift card for 1 hour of your time while helping us build better investing tools for the individual investors like yourself. Sign up here
