Eve & Co (CVE:EVE) Shareholders Booked A 44% Gain In The Last Year

Want to participate in a short research study? Help shape the future of investing tools and you could win a $250 gift card!
It hasn't been the best quarter for Eve & Co Incorporated (CVE:EVE) shareholders, since the share price has fallen 26% in that time. But that doesn't change the fact that the returns over the last year have been pleasing. In that time we've seen the stock easily surpass the market return, with a gain of 44%.
Check out our latest analysis for Eve & Co
We don't think Eve & Co's revenue of CA$413,711 is enough to establish significant demand. As a result, we think it's unlikely shareholders are paying much attention to current revenue, but rather speculating on growth in the years to come. Investors will be hoping that Eve & Co can make progress and gain better traction for the business, before it runs low on cash.
Companies that lack both meaningful revenue and profits are usually considered high risk. There is usually a significant chance that they will need more money for business development, putting them at the mercy of capital markets. So the share price itself impacts the value of the shares (as it determines the cost of capital). While some such companies go on to make revenue, profits, and generate value, others get hyped up by hopeful naifs before eventually going bankrupt.
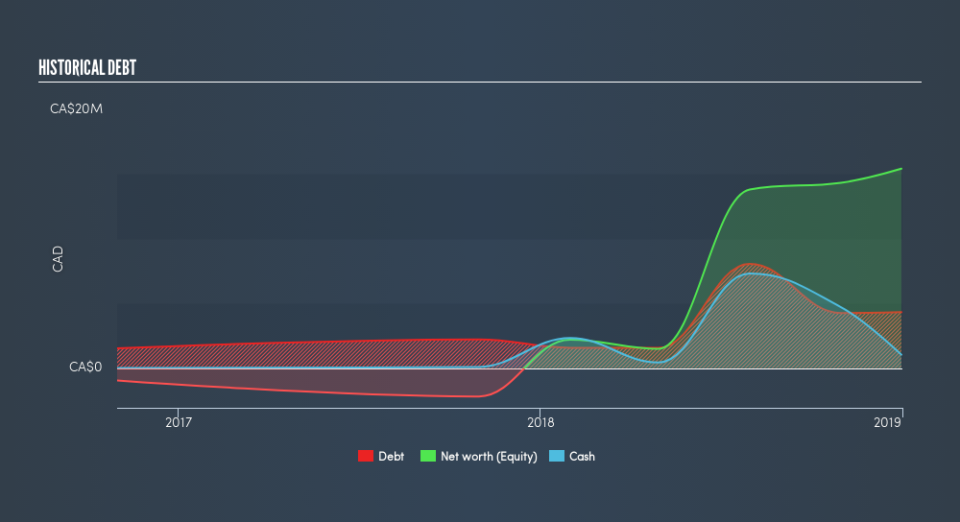
Eve & Co had liabilities exceeding cash by CA$7,034,171 when it last reported in December 2018, according to our data. That puts it in the highest risk category, according to our analysis. So we're surprised to see the stock up 44% in the last year, but we're happy for holders. It's clear more than a few people believe in the potential. You can see in the image below, how Eve & Co's cash levels have changed over time (click to see the values). You can see in the image below, how Eve & Co's cash levels have changed over time (click to see the values).
It can be extremely risky to invest in a company that doesn't even have revenue. There's no way to know its value easily. Given that situation, many of the best investors like to check if insiders have been buying shares. It's usually a positive if they have, as it may indicate they see value in the stock. Luckily we are in a position to provide you with this free chart of insider buying (and selling).
A Different Perspective
Eve & Co boasts a total shareholder return of 44% for the last year. Unfortunately the share price is down 26% over the last quarter. It may simply be that the share price got ahead of itself, although there may have been fundamental developments that are weighing on it. Shareholders might want to examine this detailed historical graph of past earnings, revenue and cash flow.
But note: Eve & Co may not be the best stock to buy. So take a peek at this free list of interesting companies with past earnings growth (and further growth forecast).
Please note, the market returns quoted in this article reflect the market weighted average returns of stocks that currently trade on CA exchanges.
We aim to bring you long-term focused research analysis driven by fundamental data. Note that our analysis may not factor in the latest price-sensitive company announcements or qualitative material.
If you spot an error that warrants correction, please contact the editor at editorial-team@simplywallst.com. This article by Simply Wall St is general in nature. It does not constitute a recommendation to buy or sell any stock, and does not take account of your objectives, or your financial situation. Simply Wall St has no position in the stocks mentioned. Thank you for reading.

 Yahoo Finance
