
 Yahoo Finance
 EUR/USD Mid-Session Technical Analysis for February 21, 2019
The Euro is trading flat shortly before the release of the European Central Bank Monetary Policy Minutes. Traders expect the ECB minutes to be dovish, however, since it telegraphed this news in its last monetary policy statement, it may have already been priced into the market.
Earlier today, the IHS Markit’s Flash Composite Purchasing Manager’s Index rose to 51.4 this month from a final January reading of 51.0, above the 51.1 forecast.
“The Euro Zone economy remained close to stagnation in February. The general picture remained one of a more subdued business environment than seen throughout much of last year,” Chris Williamson, IHS Markit’s chief business economist said.
The flash manufacturing PMI tumbled to 49.2 this month, its lowest since mid-2013. This puts it well below the 50-mark which reaffirms the contraction. Traders were looking for a reading of 50.3.
German Flash Manufacturing PMI fell to 47.6, deepening the contraction.
At 11:49 GMT, the EUR/USD is trading 1.1342, up 0.0005 or +0.04%.
Daily Technical Analysis
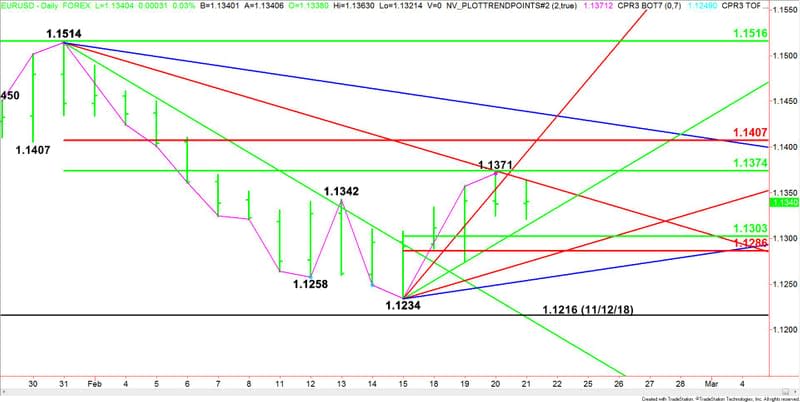
The main trend is up according to the daily swing chart. However, momentum shifted to the downside with the formation of the closing price reversal top on Wednesday. A trade through 1.1371 will negate the closing price reversal top and signal a resumption of the uptrend. A trade through 1.1234 will change the main trend to down.
The minor trend is also up. A trade through 1.1275 will change the minor trend to down and confirm the shift in momentum.
The main range is 1.1514 to 1.1234. Its retracement zone at 1.1374 to 1.1407 is the primary upside target. Yesterday’s rally to 1.1371 stopped slightly below this zone.
The short-term range is 1.1234 to 1.1371. Its retracement zone at 1.1303 to 1.1286 is the primary downside target. Since the trend is up buyers could show up on a test of this zone. They are going to try to form a secondary higher bottom.
Daily Technical Forecast
Based on the early price action, the direction of the EUR/USD on Thursday is likely to be determined by trader reaction to the downtrending Gann angle at 1.1364.
Bullish Scenario
A sustained move over 1.1364 will indicate the return of buyers. This could trigger a rally into 1.1371 to 1.1374. The buying will strengthen on a move over 1.1374 with the next target the Fibonacci level at 1.1407. This is the trigger point for an acceleration to the upside with the next target angle coming in at 1.1439.
Bearish Scenario
A sustained move under 1.1364 will signal the presence of sellers. If this creates enough downside momentum then look for the selling to extend into the uptrending Gann angle at 1.1314. Look for a technical bounce on the first test of this angle. If it fails then look for the selling to extend into the retracement zone at 1.1303 to 1.1286. Buyers could also show up on a test of this zone.
This article was originally posted on FX Empire
More From FXEMPIRE:
Crude Oil Price Update – Slow Trade Puts Market in Position to Post Closing Price Reversal Top
E-mini S&P 500 Index (ES) Futures Technical Analysis – February 21, 2019 Forecast
Natural Gas Price Forecast – natural gas continues to rotate
Crude Oil Price Forecast – crude oil markets stall at resistance
Fed Minutes Not So Dovish, Scandal Rocks EU, The Trade Deal Is Coming Into Focus
