
 Yahoo Finance
 Estimating The Fair Value Of Alphinat Inc. (CVE:NPA)
Key Insights
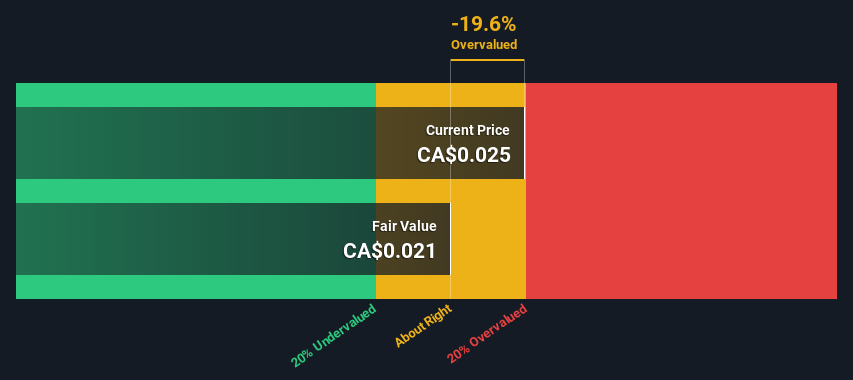
The projected fair value for Alphinat is CA$0.021 based on 2 Stage Free Cash Flow to Equity
With CA$0.025 share price, Alphinat appears to be trading close to its estimated fair value
Industry average of 27% suggests Alphinat's peers are currently trading at a higher premium to fair value
Today we'll do a simple run through of a valuation method used to estimate the attractiveness of Alphinat Inc. (CVE:NPA) as an investment opportunity by taking the forecast future cash flows of the company and discounting them back to today's value. We will take advantage of the Discounted Cash Flow (DCF) model for this purpose. It may sound complicated, but actually it is quite simple!
We would caution that there are many ways of valuing a company and, like the DCF, each technique has advantages and disadvantages in certain scenarios. If you want to learn more about discounted cash flow, the rationale behind this calculation can be read in detail in the Simply Wall St analysis model.
Check out our latest analysis for Alphinat
The Calculation
We're using the 2-stage growth model, which simply means we take in account two stages of company's growth. In the initial period the company may have a higher growth rate and the second stage is usually assumed to have a stable growth rate. To begin with, we have to get estimates of the next ten years of cash flows. Seeing as no analyst estimates of free cash flow are available to us, we have extrapolate the previous free cash flow (FCF) from the company's last reported value. We assume companies with shrinking free cash flow will slow their rate of shrinkage, and that companies with growing free cash flow will see their growth rate slow, over this period. We do this to reflect that growth tends to slow more in the early years than it does in later years.
Generally we assume that a dollar today is more valuable than a dollar in the future, so we need to discount the sum of these future cash flows to arrive at a present value estimate:
10-year free cash flow (FCF) forecast
2023 | 2024 | 2025 | 2026 | 2027 | 2028 | 2029 | 2030 | 2031 | 2032 | |
Levered FCF (CA$, Millions) | CA$141.3k | CA$116.2k | CA$102.4k | CA$94.5k | CA$89.8k | CA$87.2k | CA$85.9k | CA$85.4k | CA$85.6k | CA$86.1k |
Growth Rate Estimate Source | Est @ -26.05% | Est @ -17.71% | Est @ -11.87% | Est @ -7.78% | Est @ -4.92% | Est @ -2.91% | Est @ -1.51% | Est @ -0.53% | Est @ 0.16% | Est @ 0.64% |
Present Value (CA$, Millions) Discounted @ 8.0% | CA$0.1 | CA$0.1 | CA$0.08 | CA$0.07 | CA$0.06 | CA$0.05 | CA$0.05 | CA$0.05 | CA$0.04 | CA$0.04 |
("Est" = FCF growth rate estimated by Simply Wall St)
Present Value of 10-year Cash Flow (PVCF) = CA$675k
We now need to calculate the Terminal Value, which accounts for all the future cash flows after this ten year period. For a number of reasons a very conservative growth rate is used that cannot exceed that of a country's GDP growth. In this case we have used the 5-year average of the 10-year government bond yield (1.8%) to estimate future growth. In the same way as with the 10-year 'growth' period, we discount future cash flows to today's value, using a cost of equity of 8.0%.
Terminal Value (TV)= FCF2032 × (1 + g) ÷ (r – g) = CA$86k× (1 + 1.8%) ÷ (8.0%– 1.8%) = CA$1.4m
Present Value of Terminal Value (PVTV)= TV / (1 + r)10= CA$1.4m÷ ( 1 + 8.0%)10= CA$645k
The total value, or equity value, is then the sum of the present value of the future cash flows, which in this case is CA$1.3m. To get the intrinsic value per share, we divide this by the total number of shares outstanding. Relative to the current share price of CA$0.03, the company appears around fair value at the time of writing. The assumptions in any calculation have a big impact on the valuation, so it is better to view this as a rough estimate, not precise down to the last cent.
The Assumptions
We would point out that the most important inputs to a discounted cash flow are the discount rate and of course the actual cash flows. You don't have to agree with these inputs, I recommend redoing the calculations yourself and playing with them. The DCF also does not consider the possible cyclicality of an industry, or a company's future capital requirements, so it does not give a full picture of a company's potential performance. Given that we are looking at Alphinat as potential shareholders, the cost of equity is used as the discount rate, rather than the cost of capital (or weighted average cost of capital, WACC) which accounts for debt. In this calculation we've used 8.0%, which is based on a levered beta of 1.056. Beta is a measure of a stock's volatility, compared to the market as a whole. We get our beta from the industry average beta of globally comparable companies, with an imposed limit between 0.8 and 2.0, which is a reasonable range for a stable business.
SWOT Analysis for Alphinat
Strength
Debt is well covered by cash flow.
Weakness
Earnings declined over the past year.
Interest payments on debt are not well covered.
Current share price is above our estimate of fair value.
Opportunity
NPA's financial characteristics indicate limited near-term opportunities for shareholders.
Lack of analyst coverage makes it difficult to determine NPA's earnings prospects.
Threat
Total liabilities exceed total assets, which raises the risk of financial distress.
Next Steps:
Valuation is only one side of the coin in terms of building your investment thesis, and it is only one of many factors that you need to assess for a company. It's not possible to obtain a foolproof valuation with a DCF model. Rather it should be seen as a guide to "what assumptions need to be true for this stock to be under/overvalued?" For instance, if the terminal value growth rate is adjusted slightly, it can dramatically alter the overall result. For Alphinat, there are three pertinent elements you should consider:
Risks: Take risks, for example - Alphinat has 7 warning signs (and 4 which make us uncomfortable) we think you should know about.
Other High Quality Alternatives: Do you like a good all-rounder? Explore our interactive list of high quality stocks to get an idea of what else is out there you may be missing!
Other Environmentally-Friendly Companies: Concerned about the environment and think consumers will buy eco-friendly products more and more? Browse through our interactive list of companies that are thinking about a greener future to discover some stocks you may not have thought of!
PS. Simply Wall St updates its DCF calculation for every Canadian stock every day, so if you want to find the intrinsic value of any other stock just search here.
Have feedback on this article? Concerned about the content? Get in touch with us directly. Alternatively, email editorial-team (at) simplywallst.com.
This article by Simply Wall St is general in nature. We provide commentary based on historical data and analyst forecasts only using an unbiased methodology and our articles are not intended to be financial advice. It does not constitute a recommendation to buy or sell any stock, and does not take account of your objectives, or your financial situation. We aim to bring you long-term focused analysis driven by fundamental data. Note that our analysis may not factor in the latest price-sensitive company announcements or qualitative material. Simply Wall St has no position in any stocks mentioned.
Join A Paid User Research Session
You’ll receive a US$30 Amazon Gift card for 1 hour of your time while helping us build better investing tools for the individual investors like yourself. Sign up here
