
 Yahoo Finance
 EOG Resources, Inc. (NYSE:EOG) Is Employing Capital Very Effectively

Today we'll evaluate EOG Resources, Inc. (NYSE:EOG) to determine whether it could have potential as an investment idea. Specifically, we'll consider its Return On Capital Employed (ROCE), since that will give us an insight into how efficiently the business can generate profits from the capital it requires.
Firstly, we'll go over how we calculate ROCE. Then we'll compare its ROCE to similar companies. And finally, we'll look at how its current liabilities are impacting its ROCE.
Return On Capital Employed (ROCE): What is it?
ROCE measures the 'return' (pre-tax profit) a company generates from capital employed in its business. Generally speaking a higher ROCE is better. In brief, it is a useful tool, but it is not without drawbacks. Author Edwin Whiting says to be careful when comparing the ROCE of different businesses, since 'No two businesses are exactly alike.
How Do You Calculate Return On Capital Employed?
The formula for calculating the return on capital employed is:
Return on Capital Employed = Earnings Before Interest and Tax (EBIT) ÷ (Total Assets - Current Liabilities)
Or for EOG Resources:
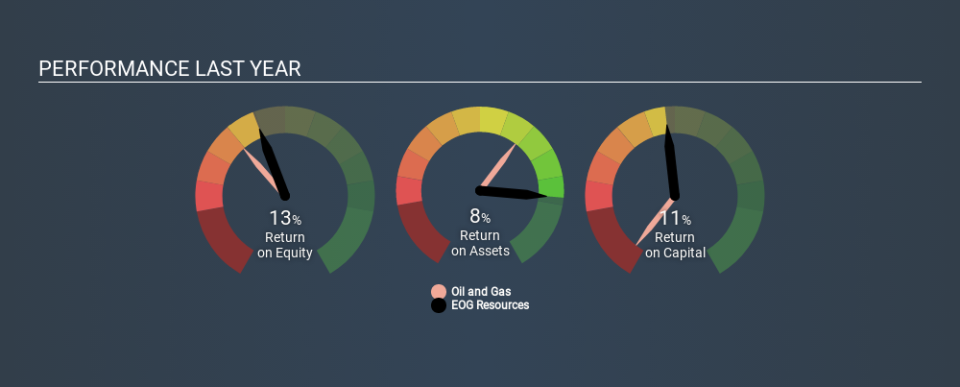
0.11 = US$3.7b ÷ (US$37b - US$4.5b) (Based on the trailing twelve months to December 2019.)
So, EOG Resources has an ROCE of 11%.
Check out our latest analysis for EOG Resources
Is EOG Resources's ROCE Good?
When making comparisons between similar businesses, investors may find ROCE useful. Using our data, we find that EOG Resources's ROCE is meaningfully better than the 6.8% average in the Oil and Gas industry. We would consider this a positive, as it suggests it is using capital more effectively than other similar companies. Independently of how EOG Resources compares to its industry, its ROCE in absolute terms appears decent, and the company may be worthy of closer investigation.
EOG Resources delivered an ROCE of 11%, which is better than 3 years ago, as was making losses back then. That implies the business has been improving. The image below shows how EOG Resources's ROCE compares to its industry, and you can click it to see more detail on its past growth.
It is important to remember that ROCE shows past performance, and is not necessarily predictive. ROCE can be deceptive for cyclical businesses, as returns can look incredible in boom times, and terribly low in downturns. ROCE is, after all, simply a snap shot of a single year. We note EOG Resources could be considered a cyclical business. Future performance is what matters, and you can see analyst predictions in our free report on analyst forecasts for the company.
Do EOG Resources's Current Liabilities Skew Its ROCE?
Liabilities, such as supplier bills and bank overdrafts, are referred to as current liabilities if they need to be paid within 12 months. The ROCE equation subtracts current liabilities from capital employed, so a company with a lot of current liabilities appears to have less capital employed, and a higher ROCE than otherwise. To check the impact of this, we calculate if a company has high current liabilities relative to its total assets.
EOG Resources has total assets of US$37b and current liabilities of US$4.5b. As a result, its current liabilities are equal to approximately 12% of its total assets. A fairly low level of current liabilities is not influencing the ROCE too much.
The Bottom Line On EOG Resources's ROCE
Overall, EOG Resources has a decent ROCE and could be worthy of further research. There might be better investments than EOG Resources out there, but you will have to work hard to find them . These promising businesses with rapidly growing earnings might be right up your alley.
If you are like me, then you will not want to miss this free list of growing companies that insiders are buying.
If you spot an error that warrants correction, please contact the editor at editorial-team@simplywallst.com. This article by Simply Wall St is general in nature. It does not constitute a recommendation to buy or sell any stock, and does not take account of your objectives, or your financial situation. Simply Wall St has no position in the stocks mentioned.
We aim to bring you long-term focused research analysis driven by fundamental data. Note that our analysis may not factor in the latest price-sensitive company announcements or qualitative material. Thank you for reading.
