
 Yahoo Finance
 How Enterprise Group, Inc. (TSE:E) Can Impact Your Portfolio Volatility

Anyone researching Enterprise Group, Inc. (TSE:E) might want to consider the historical volatility of the share price. Volatility is considered to be a measure of risk in modern finance theory. Investors may think of volatility as falling into two main categories. The first type is company specific volatility. Investors use diversification across uncorrelated stocks to reduce this kind of price volatility across the portfolio. The other type, which cannot be diversified away, is the volatility of the entire market. Every stock in the market is exposed to this volatility, which is linked to the fact that stocks prices are correlated in an efficient market.
Some stocks are more sensitive to general market forces than others. Some investors use beta as a measure of how much a certain stock is impacted by market risk (volatility). While we should keep in mind that Warren Buffett has cautioned that 'Volatility is far from synonymous with risk', beta is still a useful factor to consider. To make good use of it you must first know that the beta of the overall market is one. Any stock with a beta of greater than one is considered more volatile than the market, while those with a beta below one are either less volatile or poorly correlated with the market.
See our latest analysis for Enterprise Group
What we can learn from E's beta value
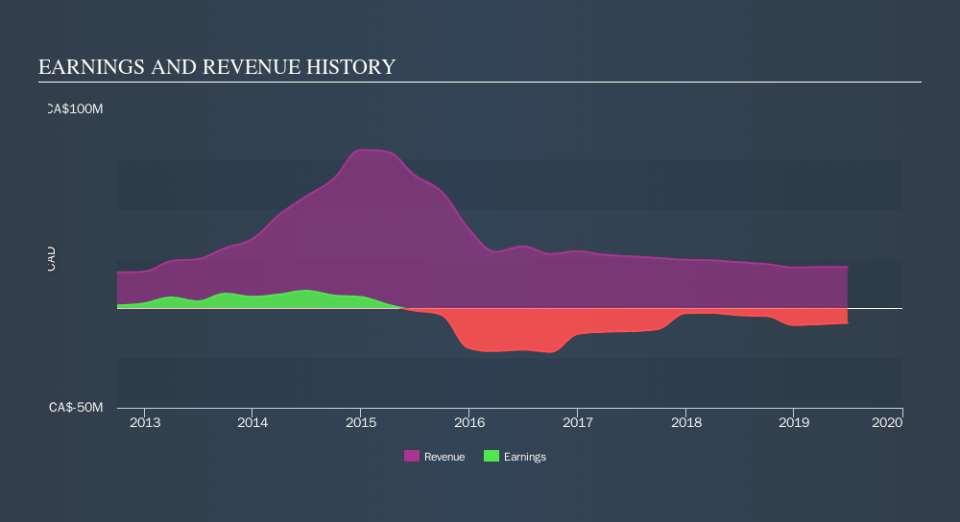
Given that it has a beta of 1.86, we can surmise that the Enterprise Group share price has been fairly sensitive to market volatility (over the last 5 years). If this beta value holds true in the future, Enterprise Group shares are likely to rise more than the market when the market is going up, but fall faster when the market is going down. Share price volatility is well worth considering, but most long term investors consider the history of revenue and earnings growth to be more important. Take a look at how Enterprise Group fares in that regard, below.
How does E's size impact its beta?
Enterprise Group is a noticeably small company, with a market capitalisation of CA$10m. Most companies this size are not always actively traded. It takes less money to influence the share price of a very small company. This may explain the excess volatility implied by this beta value.
What this means for you:
Since Enterprise Group has a reasonably high beta, it's worth considering why it is so heavily influenced by broader market sentiment. For example, it might be a high growth stock or have a lot of operating leverage in its business model. In order to fully understand whether E is a good investment for you, we also need to consider important company-specific fundamentals such as Enterprise Group’s financial health and performance track record. I highly recommend you dive deeper by considering the following:
Financial Health: Are E’s operations financially sustainable? Balance sheets can be hard to analyze, which is why we’ve done it for you. Check out our financial health checks here.
Past Track Record: Has E been consistently performing well irrespective of the ups and downs in the market? Go into more detail in the past performance analysis and take a look at the free visual representations of E's historicals for more clarity.
Other High-Performing Stocks: Are there other stocks that provide better prospects with proven track records? Explore our free list of these great stocks here.
We aim to bring you long-term focused research analysis driven by fundamental data. Note that our analysis may not factor in the latest price-sensitive company announcements or qualitative material.
If you spot an error that warrants correction, please contact the editor at editorial-team@simplywallst.com. This article by Simply Wall St is general in nature. It does not constitute a recommendation to buy or sell any stock, and does not take account of your objectives, or your financial situation. Simply Wall St has no position in the stocks mentioned. Thank you for reading.
