
 Yahoo Finance
 Ensign Group (ENSG) Stock Down 2.4% Despite Q1 Earnings Beat
Shares of The Ensign Group, Inc. ENSG lost 2.4% since it reported first-quarter 2024 results on May 1, 2024. However, it beat estimates thanks to higher skilled service revenues, an increase in skilled mix and improved occupancies. Declining cash flow from operations and a significant rise in overall expenses may have impacted investors’ sentiment about the stock.
ENSG reported a first-quarter 2024 adjusted earnings per share (EPS) of $1.30, which beat the Zacks Consensus Estimate of $1.29. The bottom line advanced 15% year over year.
Operating revenues of $1 billion improved 13.9% year over year in the quarter under review. The top line outpaced the consensus mark by 0.5%.
The Ensign Group, Inc. Price, Consensus and EPS Surprise
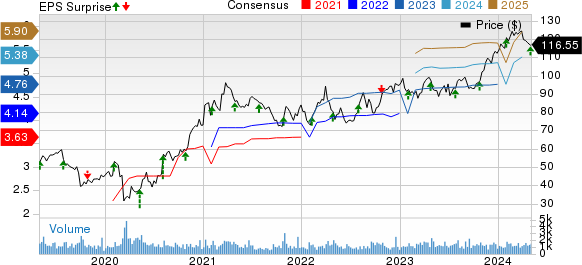
The Ensign Group, Inc. price-consensus-eps-surprise-chart | The Ensign Group, Inc. Quote
Q1 Update
Ensign Group’s adjusted net income grew 16.6% year over year to $75.4 million in the first quarter and beat of our estimate of $74.2 million.
Same-store occupancy improved 210 basis points (bps) year over year while transitioning occupancy expanded 220 bps year over year.
Total expenses of $928 million escalated 14.3 % year over year in the quarter under review and came higher than our estimate of $921.4 million. The year-over-year increase was due to higher cost of services, general and administrative expenses and rent.
Segmental Update
Skilled Services: The segment’s revenues rose 13.9% year over year to $969.6 million in the first quarter. The metric missed our estimate by a whisker. The metric was supported by improved occupancy and improved patient days. Segment income of $126.8 million improved 11.9% year over year.
Skilled nursing and campus operations of the segment totaled 264 and 27, respectively, at the first-quarter end.
Standard Bearer: Rental revenues amounted to $22.2 million, which grew 12.6% year over year and outpaced our estimate of $21.7 million. The metric was supported by rising acquisitions. Segmental income of $7.3 million advanced 0.5% year over year.
Funds from Operations were $14.1 million in the first quarter, which improved 6.8% year over year.
Financial Update (as of Mar 31, 2024)
Ensign Group exited the first quarter with cash and cash equivalents of $511.8 million, which inched up 0.4% from the 2023-end figure. It had a leftover capacity of $593.7 million under its line of credit at the first-quarter end.
Total assets of $4.3 billion rose 3.1% from the 2023-end level.
Long-term debt-less current maturities were $144.5 million, which declined 0.7% from the figure as of Dec 31, 2023. Current maturities of long-term debt amounted to $4 million.
Total equity of $1.6 billion climbed nearly 5.8% from the figure at 2023 end.
ENSG generated net cash from operations of $35.3 million in the first quarter of 2024, which plunged 27% from the year-ago figure.
Capital-Deployment Update
Ensign Group did not buy back shares in the first quarter. During the quarter, management paid dividends worth $3.4 million.
2024 Outlook Reaffirmed
Revenues are anticipated to lie within $4.13-$4.17 billion, the mid-point of which indicates an improvement of 11.3% from the 2023 figure of $3.73 billion.
Adjusted EPS is forecasted to be between $5.29 and $5.47 for 2024, the midpoint of which suggests 13% growth from the 2023 figure of $4.77.
The weighted average common shares outstanding is estimated to be around 58.5 million and the tax rate is assumed to be 25% for 2024.
Zacks Rank
Ensign Group currently carries a Zacks Rank #2 (Buy). You can see the complete list of today’s Zacks #1 Rank (Strong Buy) stocks here.
Other Medical Sector Releases
Of the Medical sector players that have reported first-quarter 2024 results so far, the bottom-line results of Humana Inc. HUM, Centene Corporation CNC and Molina Healthcare, Inc. MOH beat the Zacks Consensus Estimate.
Humana delivered first-quarter 2024 EPS of $7.23, beating the Zacks Consensus Estimate by 20.1%. However, the figure declined from earnings of $9.38 per share in the year-ago period. Adjusted revenues rose 14.3% from the previous year, reaching $29.3 billion. Also, the top line exceeded the consensus estimate by 2.6%. Total premiums amounted to $28.3 billion, which improved 10.6% year over year. Services revenues increased 6.3% year over year to almost $1.1 billion. Investment income of $288 million increased 49.2% year over year.
The benefits expense ratio was 88.9%, which deteriorated 340 bps year over year. HUM reported an operating income of $1.2 billion in the first quarter, down from the year-ago income of $1.7 billion. The Insurance segment’s adjusted revenues rose 10.8% year over year to $28.7 billion. As of Mar 31, 2024, the total medical membership of the segment was 16.17 million. The figure dipped 5.7% year over year. The CenterWell unit recorded revenues of $4.8 billion.
Centene recorded first-quarter 2024 adjusted EPS of $2.26, which outpaced the Zacks Consensus Estimate by 8.1%. The bottom line improved 7.1% year over year. Revenues advanced 3.9% year over year to $40.4 billion. The top line beat the consensus mark by 11%. Revenues from Medicaid amounted to $21.5 billion, which slipped 3% year over year in the quarter under review, while Medicare revenues inched up 1% year over year to $5.9 billion.
Additionally, commercial revenues of $7.8 billion climbed 48% year over year. Premiums of CNC rose 5% year over year to $35.5 billion. Service revenues of $808 million declined 28.3% year over year. As of Mar 31, 2024, total membership was 28.4 million, which dipped marginally year over year. Adjusted net earnings grew 4.1% year over year to $1.22 billion.
Molina Healthcare reported first-quarter 2024 adjusted EPS of $5.73, which beat the Zacks Consensus Estimate by 5%. However, the bottom line dipped 1.4% year over year. Total revenues amounted to $9.9 billion, which improved 21.9% year over year. Also, the top line outpaced the consensus mark by 4.3%. Premium revenues of $9.5 billion climbed 21% year over year in the quarter under review.
Investment income soared 52.1% year over year to $108 million. Adjusted general and administrative expense ratio deteriorated 10 bps year over year to 7.1%. MOH’s adjusted net income dipped 0.9% year over year to $334 million. The consolidated MCR (medical costs as a percentage of premium revenues), was 88.5% in the quarter under review. The metric deteriorated 140 bps year over year. As of Mar 31, 2024, total membership advanced 9% year over year to around 5.7 million.
Want the latest recommendations from Zacks Investment Research? Today, you can download 7 Best Stocks for the Next 30 Days. Click to get this free report
Humana Inc. (HUM) : Free Stock Analysis Report
Molina Healthcare, Inc (MOH) : Free Stock Analysis Report
Centene Corporation (CNC) : Free Stock Analysis Report
The Ensign Group, Inc. (ENSG) : Free Stock Analysis Report
