
 Yahoo Finance
 EMVision Medical Devices (ASX:EMV) shareholders have earned a 35% CAGR over the last five years
For many, the main point of investing in the stock market is to achieve spectacular returns. And we've seen some truly amazing gains over the years. Don't believe it? Then look at the EMVision Medical Devices Ltd (ASX:EMV) share price. It's 355% higher than it was five years ago. This just goes to show the value creation that some businesses can achieve. Also pleasing for shareholders was the 27% gain in the last three months.
Let's take a look at the underlying fundamentals over the longer term, and see if they've been consistent with shareholders returns.
See our latest analysis for EMVision Medical Devices
EMVision Medical Devices isn't currently profitable, so most analysts would look to revenue growth to get an idea of how fast the underlying business is growing. Generally speaking, companies without profits are expected to grow revenue every year, and at a good clip. That's because fast revenue growth can be easily extrapolated to forecast profits, often of considerable size.
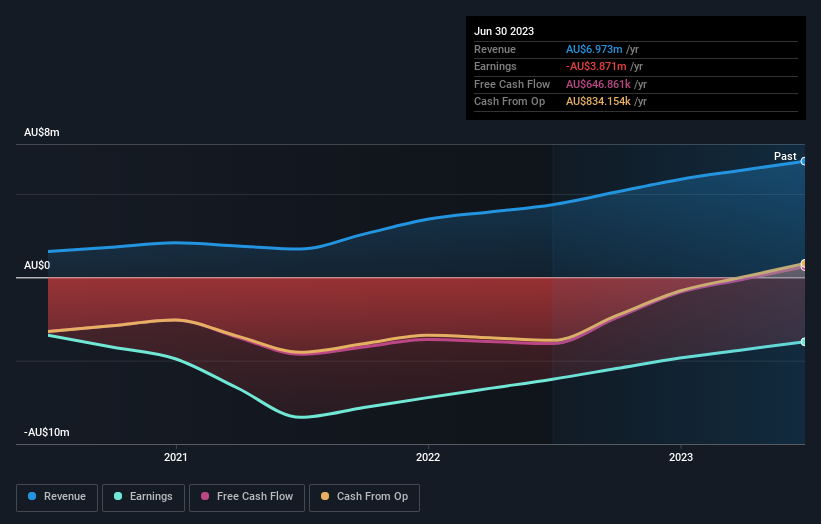
For the last half decade, EMVision Medical Devices can boast revenue growth at a rate of 41% per year. That's well above most pre-profit companies. Fortunately, the market has not missed this, and has pushed the share price up by 35% per year in that time. Despite the strong run, top performers like EMVision Medical Devices have been known to go on winning for decades. So we'd recommend you take a closer look at this one, but keep in mind the market seems optimistic.
The graphic below depicts how earnings and revenue have changed over time (unveil the exact values by clicking on the image).
You can see how its balance sheet has strengthened (or weakened) over time in this free interactive graphic.
A Different Perspective
We're pleased to report that EMVision Medical Devices shareholders have received a total shareholder return of 19% over one year. However, that falls short of the 35% TSR per annum it has made for shareholders, each year, over five years. The pessimistic view would be that be that the stock has its best days behind it, but on the other hand the price might simply be moderating while the business itself continues to execute. While it is well worth considering the different impacts that market conditions can have on the share price, there are other factors that are even more important. To that end, you should learn about the 3 warning signs we've spotted with EMVision Medical Devices (including 1 which is concerning) .
If you like to buy stocks alongside management, then you might just love this free list of companies. (Hint: insiders have been buying them).
Please note, the market returns quoted in this article reflect the market weighted average returns of stocks that currently trade on Australian exchanges.
Have feedback on this article? Concerned about the content? Get in touch with us directly. Alternatively, email editorial-team (at) simplywallst.com.
This article by Simply Wall St is general in nature. We provide commentary based on historical data and analyst forecasts only using an unbiased methodology and our articles are not intended to be financial advice. It does not constitute a recommendation to buy or sell any stock, and does not take account of your objectives, or your financial situation. We aim to bring you long-term focused analysis driven by fundamental data. Note that our analysis may not factor in the latest price-sensitive company announcements or qualitative material. Simply Wall St has no position in any stocks mentioned.
