
 Yahoo Finance
 Empire (TSE:EMP.A) shareholders have earned a 16% CAGR over the last five years
Generally speaking the aim of active stock picking is to find companies that provide returns that are superior to the market average. And in our experience, buying the right stocks can give your wealth a significant boost. For example, long term Empire Company Limited (TSE:EMP.A) shareholders have enjoyed a 95% share price rise over the last half decade, well in excess of the market return of around 31% (not including dividends). However, more recent returns haven't been as impressive as that, with the stock returning just 19% in the last year , including dividends .
Let's take a look at the underlying fundamentals over the longer term, and see if they've been consistent with shareholders returns.
See our latest analysis for Empire
To paraphrase Benjamin Graham: Over the short term the market is a voting machine, but over the long term it's a weighing machine. One flawed but reasonable way to assess how sentiment around a company has changed is to compare the earnings per share (EPS) with the share price.
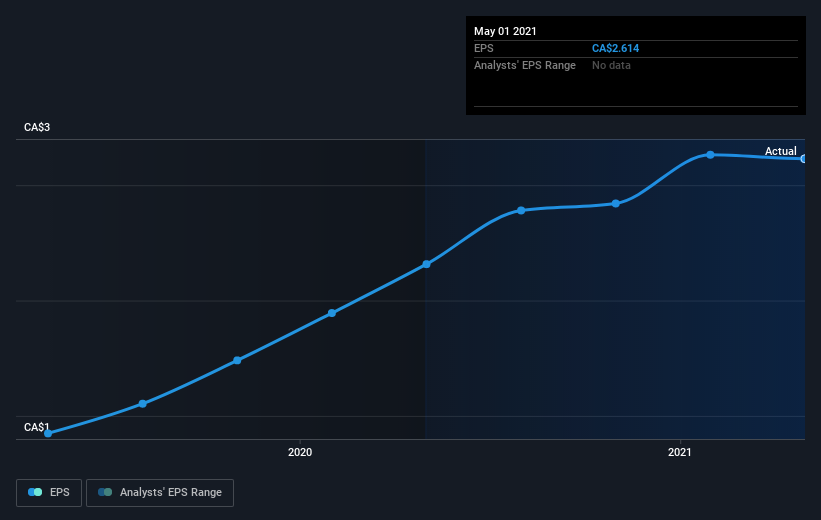
During the last half decade, Empire became profitable. That would generally be considered a positive, so we'd expect the share price to be up. Given that the company made a profit three years ago, but not five years ago, it is worth looking at the share price returns over the last three years, too. We can see that the Empire share price is up 65% in the last three years. During the same period, EPS grew by 65% each year. This EPS growth is higher than the 18% average annual increase in the share price over the same three years. So you might conclude the market is a little more cautious about the stock, these days.
You can see how EPS has changed over time in the image below (click on the chart to see the exact values).
We know that Empire has improved its bottom line over the last three years, but what does the future have in store? You can see how its balance sheet has strengthened (or weakened) over time in this free interactive graphic.
What About Dividends?
When looking at investment returns, it is important to consider the difference between total shareholder return (TSR) and share price return. The TSR incorporates the value of any spin-offs or discounted capital raisings, along with any dividends, based on the assumption that the dividends are reinvested. So for companies that pay a generous dividend, the TSR is often a lot higher than the share price return. As it happens, Empire's TSR for the last 5 years was 113%, which exceeds the share price return mentioned earlier. This is largely a result of its dividend payments!
A Different Perspective
Empire provided a TSR of 19% over the last twelve months. Unfortunately this falls short of the market return. The silver lining is that the gain was actually better than the average annual return of 16% per year over five year. This could indicate that the company is winning over new investors, as it pursues its strategy. If you would like to research Empire in more detail then you might want to take a look at whether insiders have been buying or selling shares in the company.
We will like Empire better if we see some big insider buys. While we wait, check out this free list of growing companies with considerable, recent, insider buying.
Please note, the market returns quoted in this article reflect the market weighted average returns of stocks that currently trade on CA exchanges.
This article by Simply Wall St is general in nature. We provide commentary based on historical data and analyst forecasts only using an unbiased methodology and our articles are not intended to be financial advice. It does not constitute a recommendation to buy or sell any stock, and does not take account of your objectives, or your financial situation. We aim to bring you long-term focused analysis driven by fundamental data. Note that our analysis may not factor in the latest price-sensitive company announcements or qualitative material. Simply Wall St has no position in any stocks mentioned.
Have feedback on this article? Concerned about the content? Get in touch with us directly. Alternatively, email editorial-team (at) simplywallst.com.
