
 Yahoo Finance
 Is Electrovaya Inc. (TSE:EFL) Overpaying Its CEO?

Sankar Gupta is the CEO of Electrovaya Inc. (TSE:EFL). This analysis aims first to contrast CEO compensation with other companies that have similar market capitalization. After that, we will consider the growth in the business. And finally we will reflect on how common stockholders have fared in the last few years, as a secondary measure of performance. This process should give us an idea about how appropriately the CEO is paid.
View our latest analysis for Electrovaya
How Does Sankar Gupta’s Compensation Compare With Similar Sized Companies?
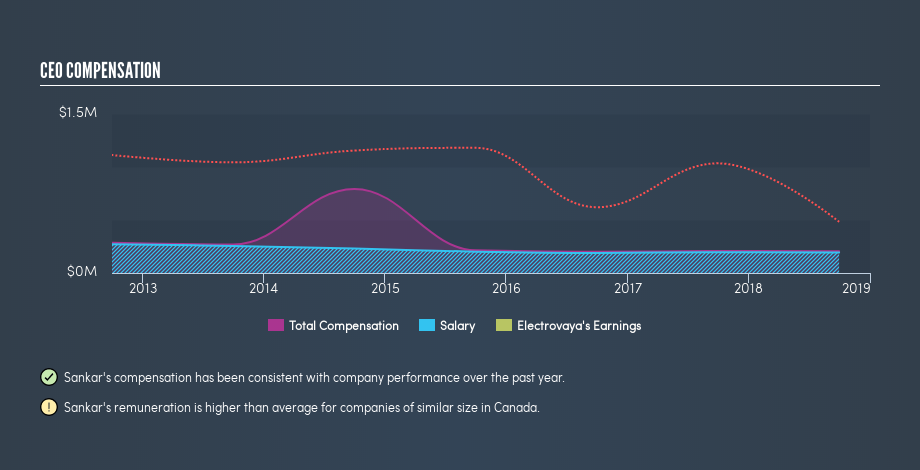
At the time of writing our data says that Electrovaya Inc. has a market cap of CA$18m, and is paying total annual CEO compensation of US$206k. (This number is for the twelve months until September 2018). That’s less than last year. We think total compensation is more important but we note that the CEO salary is lower, at US$195k. We looked at a group of companies with market capitalizations under US$200m, and the median CEO compensation was US$108k.
Thus we can conclude that Sankar Gupta receives more in total compensation than the median of a group of companies in the same market, and of similar size to Electrovaya Inc.. However, this doesn’t necessarily mean the pay is too high. We can better assess whether the pay is overly generous by looking into the underlying business performance.
You can see a visual representation of the CEO compensation at Electrovaya, below.
Is Electrovaya Inc. Growing?
On average over the last three years, Electrovaya Inc. has shrunk earnings per share by 47% each year (measured with a line of best fit). It achieved revenue growth of 199% over the last year.
The reduction in earnings per share, over three years, is arguably concerning. On the other hand, the strong revenue growth suggests the business is growing. In conclusion we can’t form a strong opinion about business performance yet; but it’s one worth watching. Although we don’t have analyst forecasts, you could get a better understanding of its growth by checking out this more detailed historical graph of earnings, revenue and cash flow.
Has Electrovaya Inc. Been A Good Investment?
Given the total loss of 83% over three years, many shareholders in Electrovaya Inc. are probably rather dissatisfied, to say the least. It therefore might be upsetting for shareholders if the CEO were paid generously.
In Summary…
We compared the total CEO remuneration paid by Electrovaya Inc., and compared it to remuneration at a group of similar sized companies. We found that it pays well over the median amount paid in the benchmark group.
Over the last three years, shareholder returns have been downright disappointing, and the underlying business has failed to impress us. Although we’d stop short of calling it inappropriate, we think the CEO compensation is probably more on the generous side of things. So you may want to check if insiders are buying Electrovaya shares with their own money (free access).
Arguably, business quality is much more important than CEO compensation levels. So check out this free list of interesting companies, that have HIGH return on equity and low debt.
We aim to bring you long-term focused research analysis driven by fundamental data. Note that our analysis may not factor in the latest price-sensitive company announcements or qualitative material.
If you spot an error that warrants correction, please contact the editor at editorial-team@simplywallst.com. This article by Simply Wall St is general in nature. It does not constitute a recommendation to buy or sell any stock, and does not take account of your objectives, or your financial situation. Simply Wall St has no position in the stocks mentioned. Thank you for reading.
