
 Yahoo Finance
 EchoStar (NASDAQ:SATS) shareholders have endured a 67% loss from investing in the stock five years ago
We think intelligent long term investing is the way to go. But unfortunately, some companies simply don't succeed. Zooming in on an example, the EchoStar Corporation (NASDAQ:SATS) share price dropped 67% in the last half decade. That's an unpleasant experience for long term holders. And it's not just long term holders hurting, because the stock is down 27% in the last year.
Now let's have a look at the company's fundamentals, and see if the long term shareholder return has matched the performance of the underlying business.
View our latest analysis for EchoStar
In his essay The Superinvestors of Graham-and-Doddsville Warren Buffett described how share prices do not always rationally reflect the value of a business. One flawed but reasonable way to assess how sentiment around a company has changed is to compare the earnings per share (EPS) with the share price.
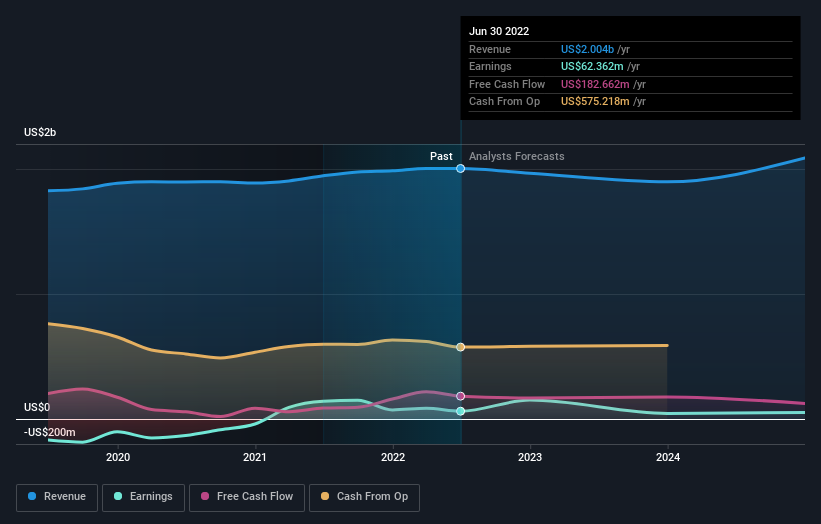
During five years of share price growth, EchoStar moved from a loss to profitability. That would generally be considered a positive, so we are surprised to see the share price is down. Other metrics may better explain the share price move.
In contrast to the share price, revenue has actually increased by 2.6% a year in the five year period. So it seems one might have to take closer look at the fundamentals to understand why the share price languishes. After all, there may be an opportunity.
The graphic below depicts how earnings and revenue have changed over time (unveil the exact values by clicking on the image).
We consider it positive that insiders have made significant purchases in the last year. Having said that, most people consider earnings and revenue growth trends to be a more meaningful guide to the business. You can see what analysts are predicting for EchoStar in this interactive graph of future profit estimates.
A Different Perspective
The total return of 27% received by EchoStar shareholders over the last year isn't far from the market return of -25%. So last year was actually even worse than the last five years, which cost shareholders 11% per year. It will probably take a substantial improvement in the fundamental performance for the company to reverse this trend. It's always interesting to track share price performance over the longer term. But to understand EchoStar better, we need to consider many other factors. Case in point: We've spotted 3 warning signs for EchoStar you should be aware of, and 1 of them is potentially serious.
EchoStar is not the only stock insiders are buying. So take a peek at this free list of growing companies with insider buying.
Please note, the market returns quoted in this article reflect the market weighted average returns of stocks that currently trade on US exchanges.
Have feedback on this article? Concerned about the content? Get in touch with us directly. Alternatively, email editorial-team (at) simplywallst.com.
This article by Simply Wall St is general in nature. We provide commentary based on historical data and analyst forecasts only using an unbiased methodology and our articles are not intended to be financial advice. It does not constitute a recommendation to buy or sell any stock, and does not take account of your objectives, or your financial situation. We aim to bring you long-term focused analysis driven by fundamental data. Note that our analysis may not factor in the latest price-sensitive company announcements or qualitative material. Simply Wall St has no position in any stocks mentioned.
Join A Paid User Research Session
You’ll receive a US$30 Amazon Gift card for 1 hour of your time while helping us build better investing tools for the individual investors like yourself. Sign up here
