
 Yahoo Finance
 Easy Come, Easy Go: How NexJ Systems (TSE:NXJ) Shareholders Got Unlucky And Saw 75% Of Their Cash Evaporate

As an investor, mistakes are inevitable. But really big losses can really drag down an overall portfolio. So consider, for a moment, the misfortune of NexJ Systems Inc. (TSE:NXJ) investors who have held the stock for three years as it declined a whopping 75%. That might cause some serious doubts about the merits of the initial decision to buy the stock, to put it mildly. And the ride hasn't got any smoother in recent times over the last year, with the price 46% lower in that time. Unhappily, the share price slid 5.6% in the last week.
Check out our latest analysis for NexJ Systems
NexJ Systems wasn't profitable in the last twelve months, it is unlikely we'll see a strong correlation between its share price and its earnings per share (EPS). Arguably revenue is our next best option. When a company doesn't make profits, we'd generally expect to see good revenue growth. That's because fast revenue growth can be easily extrapolated to forecast profits, often of considerable size.
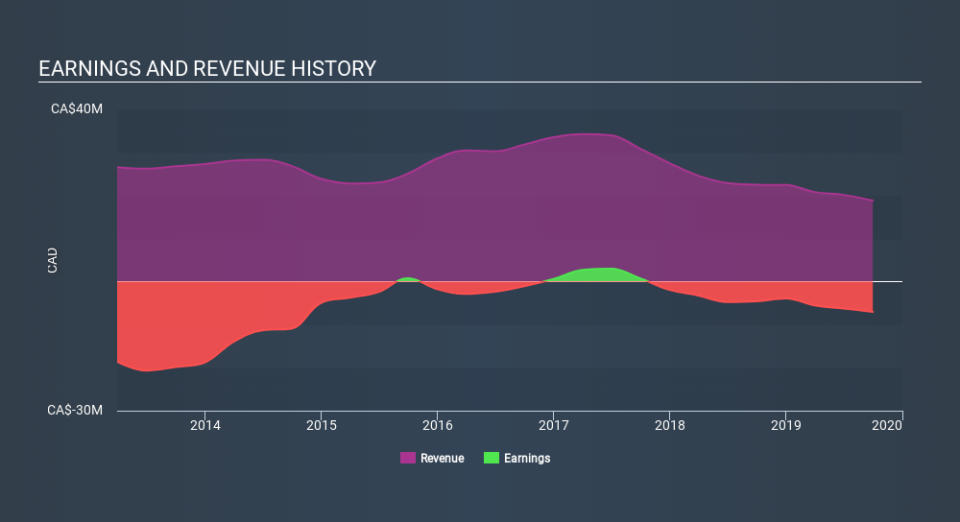
In the last three years NexJ Systems saw its revenue shrink by 21% per year. That means its revenue trend is very weak compared to other loss making companies. The swift share price decline at an annual compound rate of 37%, reflects this weak fundamental performance. We prefer leave it to clowns to try to catch falling knives, like this stock. It's worth remembering that investors call buying a steeply falling share price 'catching a falling knife' because it is a dangerous pass time.
You can see how earnings and revenue have changed over time in the image below (click on the chart to see the exact values).
This free interactive report on NexJ Systems's balance sheet strength is a great place to start, if you want to investigate the stock further.
A Different Perspective
NexJ Systems shareholders are down 46% for the year, but the market itself is up 14%. Even the share prices of good stocks drop sometimes, but we want to see improvements in the fundamental metrics of a business, before getting too interested. Unfortunately, last year's performance may indicate unresolved challenges, given that it was worse than the annualised loss of 8.3% over the last half decade. We realise that Buffett has said investors should 'buy when there is blood on the streets', but we caution that investors should first be sure they are buying a high quality businesses. Most investors take the time to check the data on insider transactions. You can click here to see if insiders have been buying or selling.
Of course NexJ Systems may not be the best stock to buy. So you may wish to see this free collection of growth stocks.
Please note, the market returns quoted in this article reflect the market weighted average returns of stocks that currently trade on CA exchanges.
If you spot an error that warrants correction, please contact the editor at editorial-team@simplywallst.com. This article by Simply Wall St is general in nature. It does not constitute a recommendation to buy or sell any stock, and does not take account of your objectives, or your financial situation. Simply Wall St has no position in the stocks mentioned.
We aim to bring you long-term focused research analysis driven by fundamental data. Note that our analysis may not factor in the latest price-sensitive company announcements or qualitative material. Thank you for reading.
