
 Yahoo Finance
 Earnings Picture Deteriorating
The following is an excerpt from this week's Earnings Trends piece. To access the full article, please click here.
We know that the earnings picture isn’t good – we saw that in the Q4 earnings season and we are seeing something similar in play in the steadily falling estimates for the current period. We have three quarters of back-to-back negative earnings growth through 2015 Q4 and the growth picture isn’t expected to change in the current and following period either. In fact, all of 2016 earnings growth is now expected to come in the second half of the year, with growth in the negative in the first half.
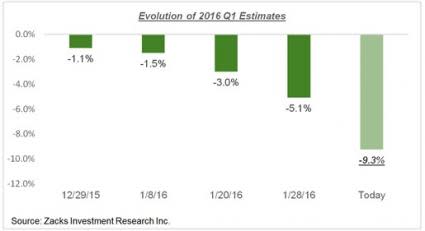
Total earnings for the S&P 500 index are currently expected to be down -9.3% from the same period last year in 2016 Q1, a sharp drop from what was expected at the start of the period. The chart below shows how growth expectations for the quarter have evolved since the start of the quarter.
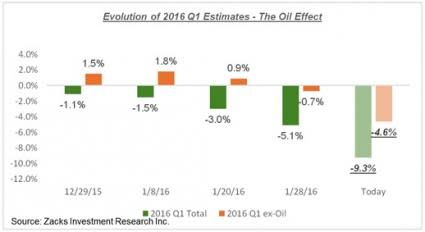
While most of the negative revisions to Q1 estimates reflect developments in the oil patch, estimates for other sectors have come down as well. You can see that in the Q1 EPS estimates for bellwether operators like Apple (AAPL), J.P. Morgan (JPM), DuPont (DD) and many others in recent days. The chart below reproduces the above revisions chart that shows the index’s Q1 earnings growth with and without the Energy sector.
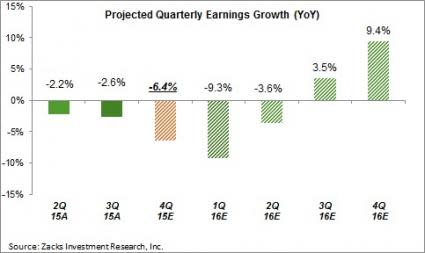
The growth challenge is expected to continue into the following quarter as well, with total 2016 Q2 earnings for the S&P 500 index currently expected to be in the negative. As you can see in the chart below, all of this year’s growth is dependent on estimates for the back-half of the year.

Part of the back-half improvement reflects an end to the Energy sector’s drag due to easier comparisons for that sector and consensus expectations of stabilization in oil prices going forward. But it’s not unusual for Wall Street analysts to be optimistic about the outer periods; they start out with a positive tone and start getting realistic only as the period gets nearer. If history is any guide, then we should see those back-half estimates start coming down in the coming months.
Estimates for 2016 as a whole have taken a beating lately as well, with total earnings for the S&P 500 index currently expected be up only +2.1% from the same period last year. This is down from expected growth of close to +8% roughly two months back – at the beginning of the year.
Q4 Scorecard for the S&P 500
We now have Q4 results from 490 S&P 500 members that combined account for 98.9% of the index’s total market capitalization. Total earnings for these companies are down -6.4% from the same period last year on -4.6% lower revenues, with 64.4% beating EPS estimates and 44.2% coming ahead of revenue estimates.
The charts below compare the results thus far with what we had seen from the same group of 490 S&P 500 members in other recent periods.

As you can see above, the beat ratios are about in-line with historical levels while the growth rates are notably on the weak side. The growth picture barely moves into positive territory even on an ex-Energy basis, but gets even worse once easy comparisons at Citigroup (C) are taken into account. The Finance sector was earlier benefiting from easy comparisons at Citigroup, but that has since been more than offset by tough comparisons at AIG (AIG).
Q4 Scorecard for the Russell 2000
For the small-cap index, we currently have Q4 results from 1466 index members or 74.6% of the index’s total members (the index currently has 1968 members). Total earnings for these 1466 companies are down -2.5% from the same period last year on -1.5% lower revenues, with 48.6% beating EPS estimates and 36.5% coming ahead of revenue expectations.
The charts below compare the growth rates and beat ratios for these 1466 Russell 2000 members with what we had seen from the same companies in 2015 Q3 and the 4-quarter average.
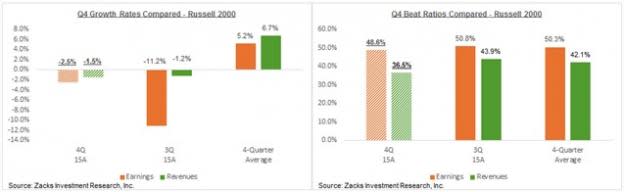
As we have pointed out in this space in the past as well, the growth challenge is as pronounced for the small-caps as it is for the large caps. And while the S&P 500 growth weakness was largely expected, the Russell 2000 weakness has come as a negative surprise with both the earnings and revenue beat ratios tracking below other recent periods, particularly on the revenues side.
Part of the back-half improvement reflects an end to the Energy sector’s drag due to easier comparisons for that sector and consensus expectations of stabilization in oil prices going forward. But it’s not unusual for Wall Street analysts to be optimistic about the outer periods; they start out with a positive tone and start getting realistic only as the period gets nearer. If history is any guide, then we should see those back-half estimate start coming down in the coming months.
To access the full article, please click here.
Note: If you want an email notification each time Sheraz Mian publishes a new article, please click here.
Want the latest recommendations from Zacks Investment Research? Today, you can download 7 Best Stocks for the Next 30 Days. Click to get this free report
To read this article on Zacks.com click here.
Zacks Investment Research
