
 Yahoo Finance
 E-mini S&P 500 Index (ES) Futures Technical Analysis – March 20, 2019 Forecast
June E-mini S&P 500 Index futures are trading steady on Wednesday shortly before the cash market opening as investors await the release of the Fed’s monetary policy decisions and economic projections. The U.S. Federal Reserve is widely expected to leave its benchmark interest rate unchanged as well as its monetary policy statement. Investors, however, are likely to react to the central bank’s decision on future rate hikes and its plan to reduce its massive balance sheet.
At 13:09 GMT, June E-mini S&P 500 Index futures are trading 2836.25, down 0.25 or -0.01%.
Daily Technical Analysis
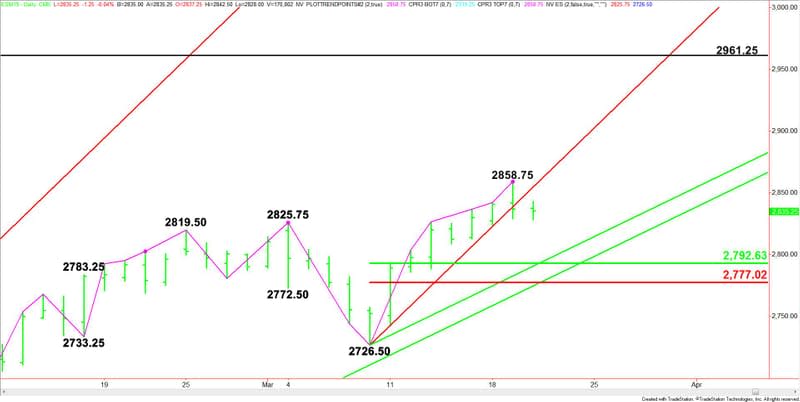
The main trend is up according to the daily swing chart. However, momentum shifted to the downside with the formation of the closing price reversal top on Tuesday and its subsequent confirmation earlier today. This chart pattern often signals the start of a 2 to 3 day correction.
A trade through 2858.75 will negate the closing price reversal top and signal a resumption of the uptrend.
The new short-term range is 2726.50 to 2858.75. Its retracement zone at 2792.50 to 2777.00 is the primary downside target.
Daily Technical Forecast
Based on the early price action and the current price at 2836.25, the direction of the June E-mini S&P 500 Index on Wednesday is likely to be determined by trader reaction to the uptrending Gann angle at 2854.50.
Bullish Scenario
Overtaking 2854.50 and sustaining the rally will indicate the presence of buyers. This could lead to a test of the closing price reversal top at 2858.75. Taking out this level could trigger an acceleration to the upside. The daily chart indicates there is plenty of room to the upside with the next major target coming in at 2961.25.
Bearish Scenario
The inability to overcome 2854.50 will signal the presence of sellers. Taking out today’s intraday low at 2828.00 will indicate the selling is getting stronger. This could trigger an acceleration to the downside with the next major target a potential support cluster at 2792.50 to 2790.50. Look for a technical bounce on the first test of this area. If it fails then look for the selling to extend into 2777.00 to 2774.75.
This article was originally posted on FX Empire
More From FXEMPIRE:
GBP/USD Price Forecast – British pound pulls back on Wednesday
E-mini Dow Jones Industrial Average (YM) Futures Technical Analysis – March 20, 2019 Forecast
Gold Price Forecast – Gold markets give back gains on Wednesday
E-mini S&P 500 Index (ES) Futures Technical Analysis – March 20, 2019 Forecast
USD/CAD Daily Price Forecast – USD/CAD Rangebound Ahead of US FOMC Update
