
 Yahoo Finance
 E-mini Dow Jones Industrial Average (YM) Futures Analysis – November 8, 2018 Forecast
December E-mini Dow Jones Industrial Average futures are trading lower shortly after the cash market opening. Profit-taking and position-squaring ahead of the Fed’s interest rate decision and monetary policy statement at 1900 GMT is behind the early selling pressure. The Fed is widely expected to leave rates unchanged. It’s also not expected to make any major changes. However, it is likely to maintain its hawkish tone.
Daily Swing Chart Technical Analysis
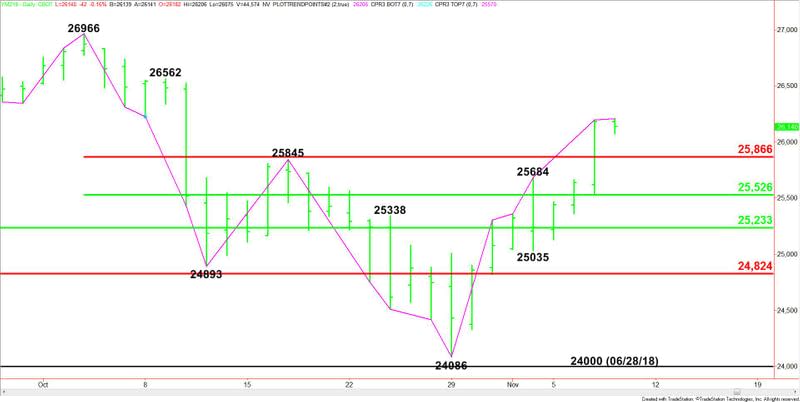
The main trend is up according to the daily swing chart. It turned up on Wednesday when buyers took out the previous main top at 25845. The next upside target is the all-time high at 26966.
Today is also the eighth day up from the recent bottom. This puts the market in a position to post a potentially bearish closing price reversal top. This won’t change the trend, but it could trigger the start of a 2 to 3 day correction.
Daily Swing Chart Technical Forecast
Based on the early price action, the direction of the December E-mini Dow Jones Industrial Average is likely to be determined by yesterday’s close at 26182.
A sustained move over 26182 will indicate the presence of buyers. The daily swing chart indicates the next upside target is a minor top at 26562. After that, the contract high at 26966 comes into play.
A sustained move under 26182 will signal the presence of sellers. This will put the Dow in a position to post a closing price reversal top.
The first downside target is a Fibonacci level at 25866. If this fails then look for an acceleration into the 50% level at 25526.
The major support zone is 25233 to 24824. This zone is 50% to 61.8% of the 2018 price range.
This article was originally posted on FX Empire
