
 Yahoo Finance
 E-mini Dow Jones Industrial Average (YM) Futures Analysis – December 08, 2017 Forecast
March E-mini Dow Jones Industrial Average futures are expected to open higher based on the pre-market trade. Investors are reacting to a bullish November jobs report that showed better-than-expected growth.
Daily Technical Analysis
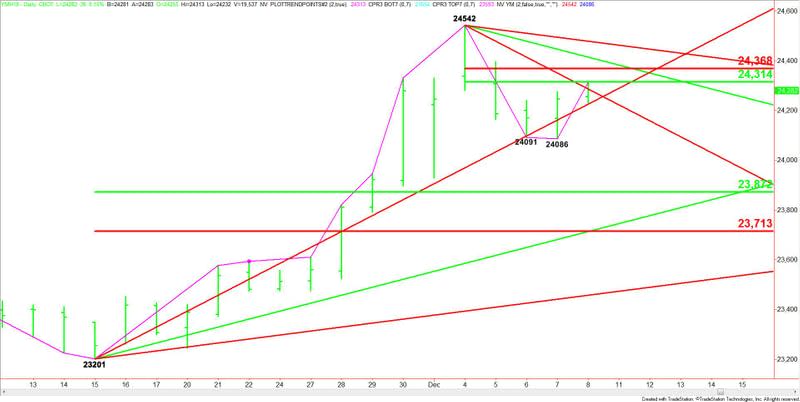
The main trend is up according to the daily swing chart. A trade through 24086 will change the trend to down. A move through 24542 will signal a resumption of the uptrend.
The short-term range is 24542 to 24086. Its retracement zone is 24314 to 24368. This zone is controlling the short-term direction of the market.
Aggressive counter-trend traders may come in on a test of this zone in an effort to form a secondary lower top. Bullish trend traders are going to try to drive through this zone in an effort to make 24086 an important main bottom and to trigger a possible test of 24542.
The main range is 23201 to 24542. If the trend changes to down, we could see a test of 23872 to 23713.
Daily Technical Forecast
Based on the early trade, the direction of the Dow today is likely to be determined by trader reaction to the long-term uptrending angle at 24225.
A sustained move over 24225 will signal the presence of buyers. This could lead to a labored rally because of potential resistance at 24286, 24314 and 24368.
Overtaking 24368 will indicate the buying is getting stronger. This could generate the upside momentum needed to challenge a pair of Gann angles at 24414 and 24478. The latter is the last potential resistance angle before the 24542 main top.
A sustained move under 24225 will indicate the presence of sellers. This will be a sign of weakness. If the selling pressure increases on the move then look for a drive into 24086.
If 24086 is taken out, the trend will change to down. This could trigger an acceleration into 23872.
This article was originally posted on FX Empire
More From FXEMPIRE:
E-mini S&P 500 Index (ES) Futures Technical Analysis – December 08, 2017 Forecas
Gold Price Futures (GC) Technical Analysis – December 08, 2017 Forecast
US Dollar Index (DX) Futures Technical Analysis – December 08, 2017 Forecast
E-mini NASDAQ-100 Index (NQ) Futures Technical Analysis – December 08, 2017 Forecast
