
 Yahoo Finance
 Has Dutch Bros Inc.'s (NYSE:BROS) Impressive Stock Performance Got Anything to Do With Its Fundamentals?
Most readers would already be aware that Dutch Bros' (NYSE:BROS) stock increased significantly by 13% over the past three months. As most would know, fundamentals are what usually guide market price movements over the long-term, so we decided to look at the company's key financial indicators today to determine if they have any role to play in the recent price movement. Particularly, we will be paying attention to Dutch Bros' ROE today.
Return on equity or ROE is an important factor to be considered by a shareholder because it tells them how effectively their capital is being reinvested. In other words, it is a profitability ratio which measures the rate of return on the capital provided by the company's shareholders.
See our latest analysis for Dutch Bros
How Is ROE Calculated?
The formula for return on equity is:
Return on Equity = Net Profit (from continuing operations) ÷ Shareholders' Equity
So, based on the above formula, the ROE for Dutch Bros is:
1.5% = US$10.0m ÷ US$676m (Based on the trailing twelve months to December 2023).
The 'return' is the amount earned after tax over the last twelve months. One way to conceptualize this is that for each $1 of shareholders' capital it has, the company made $0.01 in profit.
What Is The Relationship Between ROE And Earnings Growth?
Thus far, we have learned that ROE measures how efficiently a company is generating its profits. Depending on how much of these profits the company reinvests or "retains", and how effectively it does so, we are then able to assess a company’s earnings growth potential. Assuming everything else remains unchanged, the higher the ROE and profit retention, the higher the growth rate of a company compared to companies that don't necessarily bear these characteristics.
Dutch Bros' Earnings Growth And 1.5% ROE
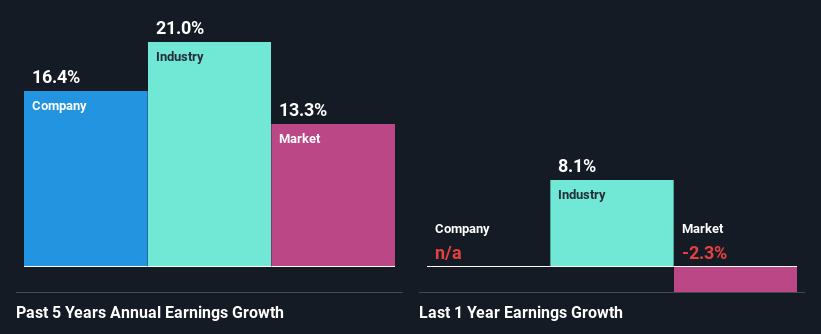
As you can see, Dutch Bros' ROE looks pretty weak. Even compared to the average industry ROE of 17%, the company's ROE is quite dismal. Although, we can see that Dutch Bros saw a modest net income growth of 16% over the past five years. We reckon that there could be other factors at play here. Such as - high earnings retention or an efficient management in place.
As a next step, we compared Dutch Bros' net income growth with the industry and were disappointed to see that the company's growth is lower than the industry average growth of 21% in the same period.
Earnings growth is an important metric to consider when valuing a stock. It’s important for an investor to know whether the market has priced in the company's expected earnings growth (or decline). Doing so will help them establish if the stock's future looks promising or ominous. One good indicator of expected earnings growth is the P/E ratio which determines the price the market is willing to pay for a stock based on its earnings prospects. So, you may want to check if Dutch Bros is trading on a high P/E or a low P/E, relative to its industry.
Is Dutch Bros Efficiently Re-investing Its Profits?
Given that Dutch Bros doesn't pay any regular dividends to its shareholders, we infer that the company has been reinvesting all of its profits to grow its business.
Conclusion
Overall, we feel that Dutch Bros certainly does have some positive factors to consider. Specifically, its fairly high earnings growth number, which no doubt was backed by the company's high earnings retention. Still, the low ROE means that all that reinvestment is not reaping a lot of benefit to the investors. Having said that, looking at the current analyst estimates, we found that the company's earnings are expected to gain momentum. To know more about the latest analysts predictions for the company, check out this visualization of analyst forecasts for the company.
Have feedback on this article? Concerned about the content? Get in touch with us directly. Alternatively, email editorial-team (at) simplywallst.com.
This article by Simply Wall St is general in nature. We provide commentary based on historical data and analyst forecasts only using an unbiased methodology and our articles are not intended to be financial advice. It does not constitute a recommendation to buy or sell any stock, and does not take account of your objectives, or your financial situation. We aim to bring you long-term focused analysis driven by fundamental data. Note that our analysis may not factor in the latest price-sensitive company announcements or qualitative material. Simply Wall St has no position in any stocks mentioned.
