
 Yahoo Finance
 Dufry (VTX:DUFN) Hasn't Managed To Accelerate Its Returns
There are a few key trends to look for if we want to identify the next multi-bagger. Amongst other things, we'll want to see two things; firstly, a growing return on capital employed (ROCE) and secondly, an expansion in the company's amount of capital employed. Put simply, these types of businesses are compounding machines, meaning they are continually reinvesting their earnings at ever-higher rates of return. However, after briefly looking over the numbers, we don't think Dufry (VTX:DUFN) has the makings of a multi-bagger going forward, but let's have a look at why that may be.
Understanding Return On Capital Employed (ROCE)
For those who don't know, ROCE is a measure of a company's yearly pre-tax profit (its return), relative to the capital employed in the business. The formula for this calculation on Dufry is:
Return on Capital Employed = Earnings Before Interest and Tax (EBIT) ÷ (Total Assets - Current Liabilities)
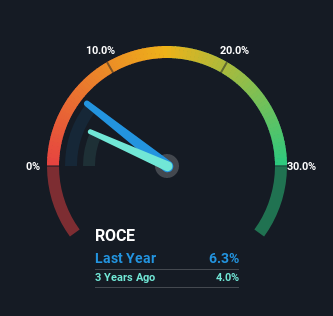
0.063 = CHF426m ÷ (CHF9.3b - CHF2.6b) (Based on the trailing twelve months to December 2022).
So, Dufry has an ROCE of 6.3%. In absolute terms, that's a low return and it also under-performs the Specialty Retail industry average of 12%.
Check out our latest analysis for Dufry
In the above chart we have measured Dufry's prior ROCE against its prior performance, but the future is arguably more important. If you're interested, you can view the analysts predictions in our free report on analyst forecasts for the company.
What Can We Tell From Dufry's ROCE Trend?
Things have been pretty stable at Dufry, with its capital employed and returns on that capital staying somewhat the same for the last five years. It's not uncommon to see this when looking at a mature and stable business that isn't re-investing its earnings because it has likely passed that phase of the business cycle. So don't be surprised if Dufry doesn't end up being a multi-bagger in a few years time.
On another note, while the change in ROCE trend might not scream for attention, it's interesting that the current liabilities have actually gone up over the last five years. This is intriguing because if current liabilities hadn't increased to 28% of total assets, this reported ROCE would probably be less than6.3% because total capital employed would be higher.The 6.3% ROCE could be even lower if current liabilities weren't 28% of total assets, because the the formula would show a larger base of total capital employed. With that in mind, just be wary if this ratio increases in the future, because if it gets particularly high, this brings with it some new elements of risk.
In Conclusion...
We can conclude that in regards to Dufry's returns on capital employed and the trends, there isn't much change to report on. And in the last five years, the stock has given away 65% so the market doesn't look too hopeful on these trends strengthening any time soon. On the whole, we aren't too inspired by the underlying trends and we think there may be better chances of finding a multi-bagger elsewhere.
One final note, you should learn about the 3 warning signs we've spotted with Dufry (including 1 which can't be ignored) .
For those who like to invest in solid companies, check out this free list of companies with solid balance sheets and high returns on equity.
Have feedback on this article? Concerned about the content? Get in touch with us directly. Alternatively, email editorial-team (at) simplywallst.com.
This article by Simply Wall St is general in nature. We provide commentary based on historical data and analyst forecasts only using an unbiased methodology and our articles are not intended to be financial advice. It does not constitute a recommendation to buy or sell any stock, and does not take account of your objectives, or your financial situation. We aim to bring you long-term focused analysis driven by fundamental data. Note that our analysis may not factor in the latest price-sensitive company announcements or qualitative material. Simply Wall St has no position in any stocks mentioned.
Join A Paid User Research Session
You’ll receive a US$30 Amazon Gift card for 1 hour of your time while helping us build better investing tools for the individual investors like yourself. Sign up here
