
 Yahoo Finance
 What Are The Drivers Of Points International Ltd’s (TSE:PTS) Risks?

If you’re interested in Points International Ltd (TSE:PTS), then you might want to consider its beta (a measure of share price volatility) in order to understand how the stock could impact your portfolio. Volatility is considered to be a measure of risk in modern finance theory. Investors may think of volatility as falling into two main categories. First, we have company specific volatility, which is the price gyrations of an individual stock. Holding at least 8 stocks can reduce this kind of risk across a portfolio. The other type, which cannot be diversified away, is the volatility of the entire market. Every stock in the market is exposed to this volatility, which is linked to the fact that stocks prices are correlated in an efficient market.
Some stocks are more sensitive to general market forces than others. Beta is a widely used metric to measure a stock’s exposure to market risk (volatility). Before we go on, it’s worth noting that Warren Buffett pointed out in his 2014 letter to shareholders that ‘volatility is far from synonymous with risk.’ Having said that, beta can still be rather useful. The first thing to understand about beta is that the beta of the overall market is one. Any stock with a beta of greater than one is considered more volatile than the market, while those with a beta below one are either less volatile or poorly correlated with the market.
See our latest analysis for Points International
What PTS’s beta value tells investors
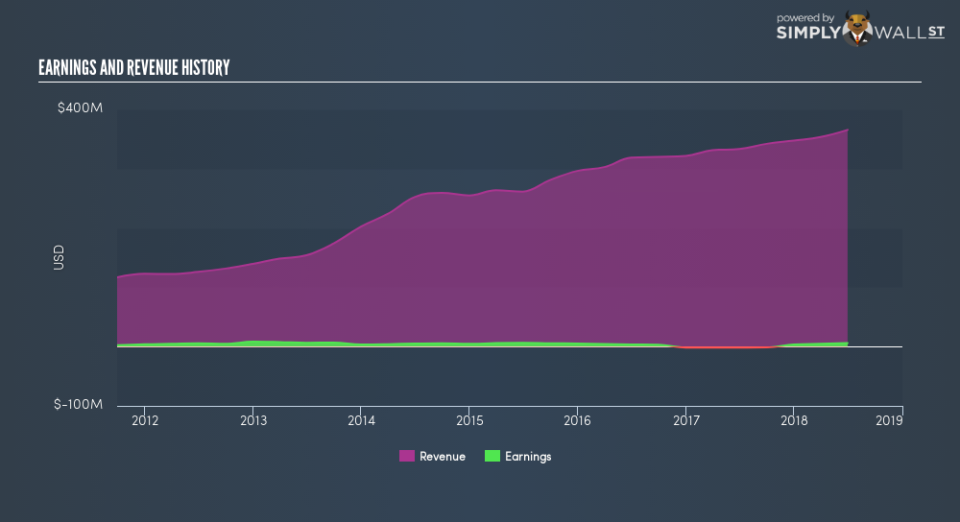
Given that it has a beta of 1.09, we can surmise that the Points International share price has been fairly sensitive to market volatility (over the last 5 years). If this beta value holds true in the future, Points International shares are likely to rise more than the market when the market is going up, but fall faster when the market is going down. Share price volatility is well worth considering, but most long term investors consider the history of revenue and earnings growth to be more important. Take a look at how Points International fares in that regard, below.
How does PTS’s size impact its beta?
Points International is a noticeably small company, with a market capitalisation of US$297.16m. Most companies this size are not always actively traded. It takes less money to influence the share price of a very small company. This may explain the excess volatility implied by this beta value.
What this means for you:
Since Points International has a reasonably high beta, it’s worth considering why it is so heavily influenced by broader market sentiment. For example, it might be a high growth stock or have a lot of operating leverage in its business model. This article aims to educate investors about beta values, but it’s well worth looking at important company-specific fundamentals such as Points International’s financial health and performance track record. I highly recommend you dive deeper by considering the following:
Future Outlook: What are well-informed industry analysts predicting for PTS’s future growth? Take a look at our free research report of analyst consensus for PTS’s outlook.
Past Track Record: Has PTS been consistently performing well irrespective of the ups and downs in the market? Go into more detail in the past performance analysis and take a look at the free visual representations of PTS’s historicals for more clarity.
Other Interesting Stocks: It’s worth checking to see how PTS measures up against other companies on valuation. You could start with this free list of prospective options.
To help readers see past the short term volatility of the financial market, we aim to bring you a long-term focused research analysis purely driven by fundamental data. Note that our analysis does not factor in the latest price-sensitive company announcements.
The author is an independent contributor and at the time of publication had no position in the stocks mentioned. For errors that warrant correction please contact the editor at editorial-team@simplywallst.com.
