
 Yahoo Finance
 Dream Finders Homes' (NYSE:DFH) Returns On Capital Are Heading Higher
There are a few key trends to look for if we want to identify the next multi-bagger. One common approach is to try and find a company with returns on capital employed (ROCE) that are increasing, in conjunction with a growing amount of capital employed. If you see this, it typically means it's a company with a great business model and plenty of profitable reinvestment opportunities. With that in mind, we've noticed some promising trends at Dream Finders Homes (NYSE:DFH) so let's look a bit deeper.
Understanding Return On Capital Employed (ROCE)
If you haven't worked with ROCE before, it measures the 'return' (pre-tax profit) a company generates from capital employed in its business. To calculate this metric for Dream Finders Homes, this is the formula:
Return on Capital Employed = Earnings Before Interest and Tax (EBIT) ÷ (Total Assets - Current Liabilities)
0.17 = US$429m ÷ (US$2.7b - US$258m) (Based on the trailing twelve months to March 2024).
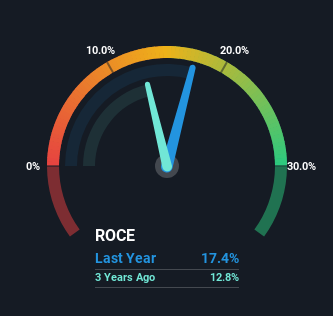
Thus, Dream Finders Homes has an ROCE of 17%. In absolute terms, that's a pretty normal return, and it's somewhat close to the Consumer Durables industry average of 15%.
See our latest analysis for Dream Finders Homes
In the above chart we have measured Dream Finders Homes' prior ROCE against its prior performance, but the future is arguably more important. If you'd like to see what analysts are forecasting going forward, you should check out our free analyst report for Dream Finders Homes .
What Can We Tell From Dream Finders Homes' ROCE Trend?
Investors would be pleased with what's happening at Dream Finders Homes. The data shows that returns on capital have increased substantially over the last five years to 17%. The amount of capital employed has increased too, by 666%. This can indicate that there's plenty of opportunities to invest capital internally and at ever higher rates, a combination that's common among multi-baggers.
In another part of our analysis, we noticed that the company's ratio of current liabilities to total assets decreased to 9.5%, which broadly means the business is relying less on its suppliers or short-term creditors to fund its operations. This tells us that Dream Finders Homes has grown its returns without a reliance on increasing their current liabilities, which we're very happy with.
Our Take On Dream Finders Homes' ROCE
To sum it up, Dream Finders Homes has proven it can reinvest in the business and generate higher returns on that capital employed, which is terrific. Given the stock has declined 17% in the last three years, this could be a good investment if the valuation and other metrics are also appealing. That being the case, research into the company's current valuation metrics and future prospects seems fitting.
If you'd like to know more about Dream Finders Homes, we've spotted 2 warning signs, and 1 of them is a bit concerning.
While Dream Finders Homes isn't earning the highest return, check out this free list of companies that are earning high returns on equity with solid balance sheets.
Have feedback on this article? Concerned about the content? Get in touch with us directly. Alternatively, email editorial-team (at) simplywallst.com.
This article by Simply Wall St is general in nature. We provide commentary based on historical data and analyst forecasts only using an unbiased methodology and our articles are not intended to be financial advice. It does not constitute a recommendation to buy or sell any stock, and does not take account of your objectives, or your financial situation. We aim to bring you long-term focused analysis driven by fundamental data. Note that our analysis may not factor in the latest price-sensitive company announcements or qualitative material. Simply Wall St has no position in any stocks mentioned.
