
 Yahoo Finance
 Dr. Martens (LON:DOCS) investors are sitting on a loss of 38% if they invested a year ago
Dr. Martens plc (LON:DOCS) shareholders should be happy to see the share price up 11% in the last month. But that is minimal compensation for the share price under-performance over the last year. After all, the share price is down 40% in the last year, significantly under-performing the market.
With that in mind, it's worth seeing if the company's underlying fundamentals have been the driver of long term performance, or if there are some discrepancies.
View our latest analysis for Dr. Martens
To quote Buffett, 'Ships will sail around the world but the Flat Earth Society will flourish. There will continue to be wide discrepancies between price and value in the marketplace...' One flawed but reasonable way to assess how sentiment around a company has changed is to compare the earnings per share (EPS) with the share price.
Even though the Dr. Martens share price is down over the year, its EPS actually improved. It could be that the share price was previously over-hyped.
The divergence between the EPS and the share price is quite notable, during the year. But we might find some different metrics explain the share price movements better.
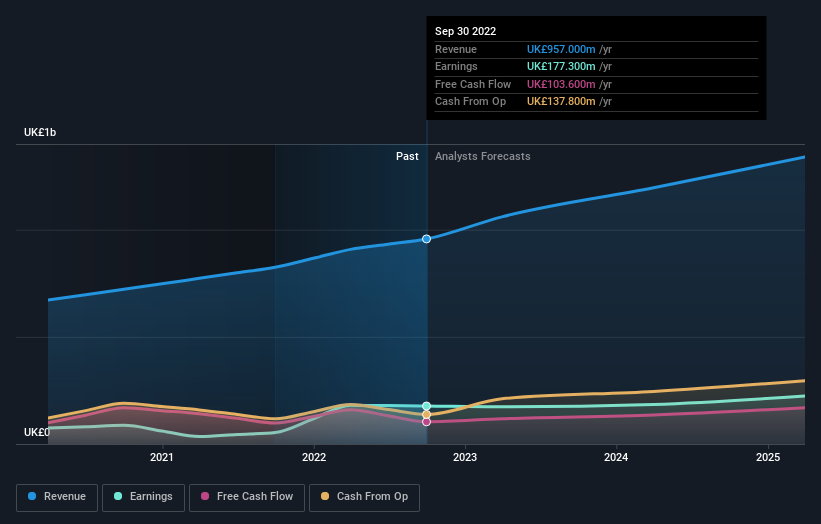
Dr. Martens managed to grow revenue over the last year, which is usually a real positive. Since the fundamental metrics don't readily explain the share price drop, there might be an opportunity if the market has overreacted.
The image below shows how earnings and revenue have tracked over time (if you click on the image you can see greater detail).
We're pleased to report that the CEO is remunerated more modestly than most CEOs at similarly capitalized companies. It's always worth keeping an eye on CEO pay, but a more important question is whether the company will grow earnings throughout the years. So we recommend checking out this free report showing consensus forecasts
A Different Perspective
We doubt Dr. Martens shareholders are happy with the loss of 38% over twelve months (even including dividends). That falls short of the market, which lost 3.3%. That's disappointing, but it's worth keeping in mind that the market-wide selling wouldn't have helped. The share price decline has continued throughout the most recent three months, down 5.6%, suggesting an absence of enthusiasm from investors. Given the relatively short history of this stock, we'd remain pretty wary until we see some strong business performance. While it is well worth considering the different impacts that market conditions can have on the share price, there are other factors that are even more important. Case in point: We've spotted 3 warning signs for Dr. Martens you should be aware of.
If you are like me, then you will not want to miss this free list of growing companies that insiders are buying.
Please note, the market returns quoted in this article reflect the market weighted average returns of stocks that currently trade on GB exchanges.
Have feedback on this article? Concerned about the content? Get in touch with us directly. Alternatively, email editorial-team (at) simplywallst.com.
This article by Simply Wall St is general in nature. We provide commentary based on historical data and analyst forecasts only using an unbiased methodology and our articles are not intended to be financial advice. It does not constitute a recommendation to buy or sell any stock, and does not take account of your objectives, or your financial situation. We aim to bring you long-term focused analysis driven by fundamental data. Note that our analysis may not factor in the latest price-sensitive company announcements or qualitative material. Simply Wall St has no position in any stocks mentioned.
Join A Paid User Research Session
You’ll receive a US$30 Amazon Gift card for 1 hour of your time while helping us build better investing tools for the individual investors like yourself. Sign up here
