
 Yahoo Finance
 DP Aircraft I (LON:DPA) Has More To Do To Multiply In Value Going Forward
If you're looking for a multi-bagger, there's a few things to keep an eye out for. In a perfect world, we'd like to see a company investing more capital into its business and ideally the returns earned from that capital are also increasing. Put simply, these types of businesses are compounding machines, meaning they are continually reinvesting their earnings at ever-higher rates of return. Having said that, from a first glance at DP Aircraft I (LON:DPA) we aren't jumping out of our chairs at how returns are trending, but let's have a deeper look.
Return On Capital Employed (ROCE): What Is It?
For those who don't know, ROCE is a measure of a company's yearly pre-tax profit (its return), relative to the capital employed in the business. Analysts use this formula to calculate it for DP Aircraft I:
Return on Capital Employed = Earnings Before Interest and Tax (EBIT) ÷ (Total Assets - Current Liabilities)
0.072 = US$11m ÷ (US$153m - US$6.3m) (Based on the trailing twelve months to June 2023).
Thus, DP Aircraft I has an ROCE of 7.2%. In absolute terms, that's a low return and it also under-performs the Trade Distributors industry average of 15%.
Check out our latest analysis for DP Aircraft I
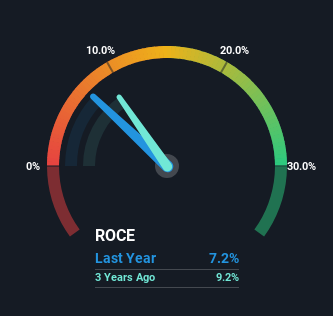
Historical performance is a great place to start when researching a stock so above you can see the gauge for DP Aircraft I's ROCE against it's prior returns. If you're interested in investigating DP Aircraft I's past further, check out this free graph covering DP Aircraft I's past earnings, revenue and cash flow.
What Can We Tell From DP Aircraft I's ROCE Trend?
We've noticed that although returns on capital are flat over the last five years, the amount of capital employed in the business has fallen 68% in that same period. When a company effectively decreases its assets base, it's not usually a sign to be optimistic on that company. In addition to that, since the ROCE doesn't scream "quality" at 7.2%, it's hard to get excited about these developments.
The Bottom Line On DP Aircraft I's ROCE
In summary, DP Aircraft I isn't reinvesting funds back into the business and returns aren't growing. Moreover, since the stock has crumbled 93% over the last five years, it appears investors are expecting the worst. In any case, the stock doesn't have these traits of a multi-bagger discussed above, so if that's what you're looking for, we think you'd have more luck elsewhere.
Since virtually every company faces some risks, it's worth knowing what they are, and we've spotted 5 warning signs for DP Aircraft I (of which 1 is concerning!) that you should know about.
While DP Aircraft I isn't earning the highest return, check out this free list of companies that are earning high returns on equity with solid balance sheets.
Have feedback on this article? Concerned about the content? Get in touch with us directly. Alternatively, email editorial-team (at) simplywallst.com.
This article by Simply Wall St is general in nature. We provide commentary based on historical data and analyst forecasts only using an unbiased methodology and our articles are not intended to be financial advice. It does not constitute a recommendation to buy or sell any stock, and does not take account of your objectives, or your financial situation. We aim to bring you long-term focused analysis driven by fundamental data. Note that our analysis may not factor in the latest price-sensitive company announcements or qualitative material. Simply Wall St has no position in any stocks mentioned.
