
 Yahoo Finance
 Douglas Dynamics' (NYSE:PLOW) Returns On Capital Not Reflecting Well On The Business
If we're looking to avoid a business that is in decline, what are the trends that can warn us ahead of time? Businesses in decline often have two underlying trends, firstly, a declining return on capital employed (ROCE) and a declining base of capital employed. This combination can tell you that not only is the company investing less, it's earning less on what it does invest. On that note, looking into Douglas Dynamics (NYSE:PLOW), we weren't too upbeat about how things were going.
What Is Return On Capital Employed (ROCE)?
Just to clarify if you're unsure, ROCE is a metric for evaluating how much pre-tax income (in percentage terms) a company earns on the capital invested in its business. To calculate this metric for Douglas Dynamics, this is the formula:
Return on Capital Employed = Earnings Before Interest and Tax (EBIT) ÷ (Total Assets - Current Liabilities)
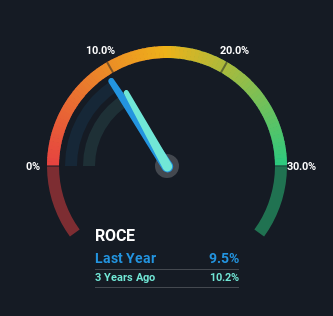
0.095 = US$45m ÷ (US$593m - US$119m) (Based on the trailing twelve months to December 2023).
Thus, Douglas Dynamics has an ROCE of 9.5%. Ultimately, that's a low return and it under-performs the Machinery industry average of 13%.
Check out our latest analysis for Douglas Dynamics
Above you can see how the current ROCE for Douglas Dynamics compares to its prior returns on capital, but there's only so much you can tell from the past. If you'd like to see what analysts are forecasting going forward, you should check out our free analyst report for Douglas Dynamics .
What Does the ROCE Trend For Douglas Dynamics Tell Us?
The trend of returns that Douglas Dynamics is generating are raising some concerns. The company used to generate 12% on its capital five years ago but it has since fallen noticeably. What's equally concerning is that the amount of capital deployed in the business has shrunk by 20% over that same period. The fact that both are shrinking is an indication that the business is going through some tough times. If these underlying trends continue, we wouldn't be too optimistic going forward.
The Bottom Line On Douglas Dynamics' ROCE
In summary, it's unfortunate that Douglas Dynamics is shrinking its capital base and also generating lower returns. Long term shareholders who've owned the stock over the last five years have experienced a 25% depreciation in their investment, so it appears the market might not like these trends either. That being the case, unless the underlying trends revert to a more positive trajectory, we'd consider looking elsewhere.
Douglas Dynamics does come with some risks though, we found 3 warning signs in our investment analysis, and 2 of those are a bit concerning...
If you want to search for solid companies with great earnings, check out this free list of companies with good balance sheets and impressive returns on equity.
Have feedback on this article? Concerned about the content? Get in touch with us directly. Alternatively, email editorial-team (at) simplywallst.com.
This article by Simply Wall St is general in nature. We provide commentary based on historical data and analyst forecasts only using an unbiased methodology and our articles are not intended to be financial advice. It does not constitute a recommendation to buy or sell any stock, and does not take account of your objectives, or your financial situation. We aim to bring you long-term focused analysis driven by fundamental data. Note that our analysis may not factor in the latest price-sensitive company announcements or qualitative material. Simply Wall St has no position in any stocks mentioned.
