
 Yahoo Finance
 Double-Bottom: Harness the Power of this Explosive Base
Study the Past to Take Advantage of the Future
“All through time, people have basically acted and reacted the same way in the market as a result of greed, fear, ignorance, and hope. That is why the numerical formations and patterns recur on a constant basis. Over and over, with slight variations. Because markets are driven by humans and human nature never changes.” ~ Jesse Livermore
Though legendary investor Jesse Livermore was around a century ago, his advice still holds true to this day and is as fresh as ever. Investors can’t predict the future. However, by studying the past, investors can recognize patterns that tend to repeat in the stock market and use them to gain an edge. Like a casino operator, a slight edge played out over a series of trades can lead to big results.
The Double Bottom Pattern: An Explosive Set-Up
In technical analysis, a double-bottom base structure is a bullish chart pattern. The pattern resembles the letter “W” and is characterized by two distinct troughs at approximately the same price level, separated by a peak in between. Traders often look for this pattern because it signifies a period where selling pressure has diminished, and buyers are gradually gaining control of the market. The confirmation of a double-bottom pattern occurs when the stock price breaks above the peak that separates the two troughs.
Nvidia Precedent
A good precedent for investors to study is the double-bottom pattern that occurred in chip leader Nvidia (NVDA). In February 2016, Nvidia gapped out of a double-bottom base structure after reporting earnings. Over the next year, shares never looked back and gained a mindboggling 400%.
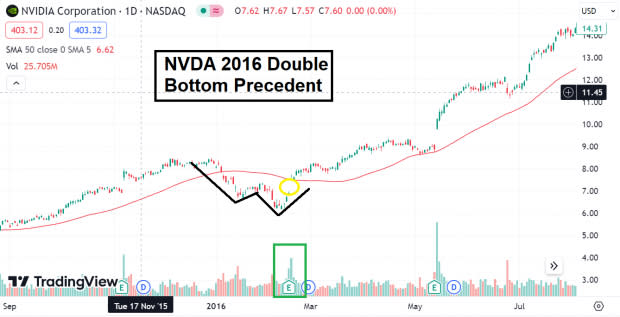
Image Source: TradingView
Of course, not all double bottoms are created equally. Below are the main attributes to look for in a double bottom:
Strong Uptrend Prior to Base Structure: Stocks tend to exit bases in the same direction they entered. In other words, make sure the stock is up-trending before it forms the base. Remember, the trend is your friend.
Shakeout: A subtle yet vital clue to look for in a double bottom base is an undercut of the first trough on the second trough. By undercutting the first trough, the stock shakes out the “weak hands.”
Gap Up on Massive Volume: A recurring theme in the biggest double-bottom winners is a gap up (often earnings-induced) on heavy volume. Gap-ups indicate that demand has returned to the stock. When NVDA gapped up in our 2016 example, volume exploded to 187% above the 50-day average.
Strong Industry Group: As with any stock, a strong industry group can be a significant tailwind. In 2016, semiconductors were by far the strongest industry group.
Robust Earnings Growth: Ultimately, fundamentals drive stocks.Stocks with the best returns out of double-bottom bases had earnings growth of 40% or more year-over-year.
Arista Networks: Nvidia 2.0?
Tuesday, shares of cloud networking solutions provider Arista Networks (ANET) gapped out of a double bottom base structure and rose ~13% on volume four times the norm.
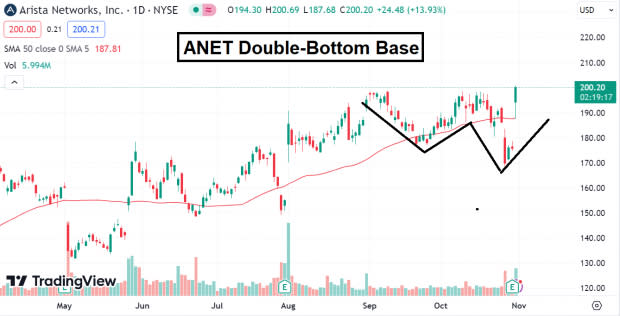
Image Source: TradingView
Arista checks all the boxes for a potential mega-winner and has a strong uptrend, shakeout below the first trough, and a large gap-up on volume. Arista is part of the hot database industry that benefits from the AI revolution, and earnings are growing at a blistering 46% year-over-year.
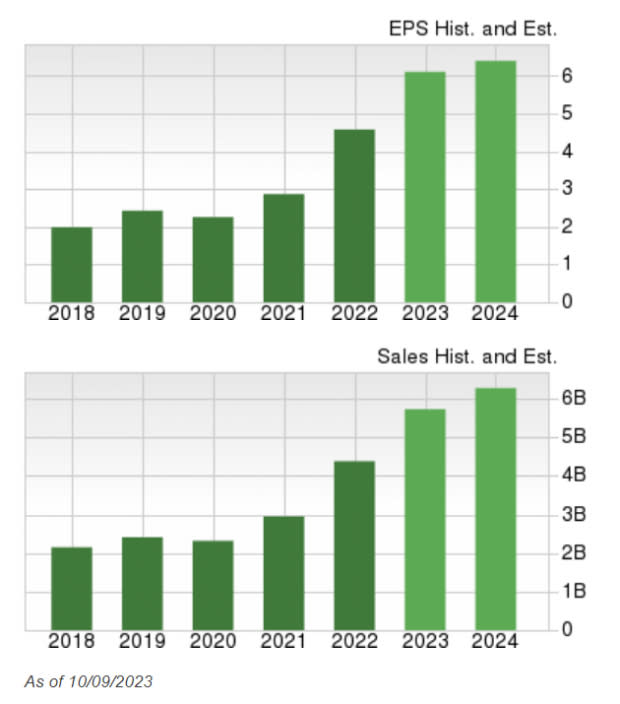
Image Source: Zacks Investment Research
Want the latest recommendations from Zacks Investment Research? Today, you can download 7 Best Stocks for the Next 30 Days. Click to get this free report
NVIDIA Corporation (NVDA) : Free Stock Analysis Report
Arista Networks, Inc. (ANET) : Free Stock Analysis Report
