
 Yahoo Finance
 Don't Sell Sysco Corporation (NYSE:SYY) Before You Read This

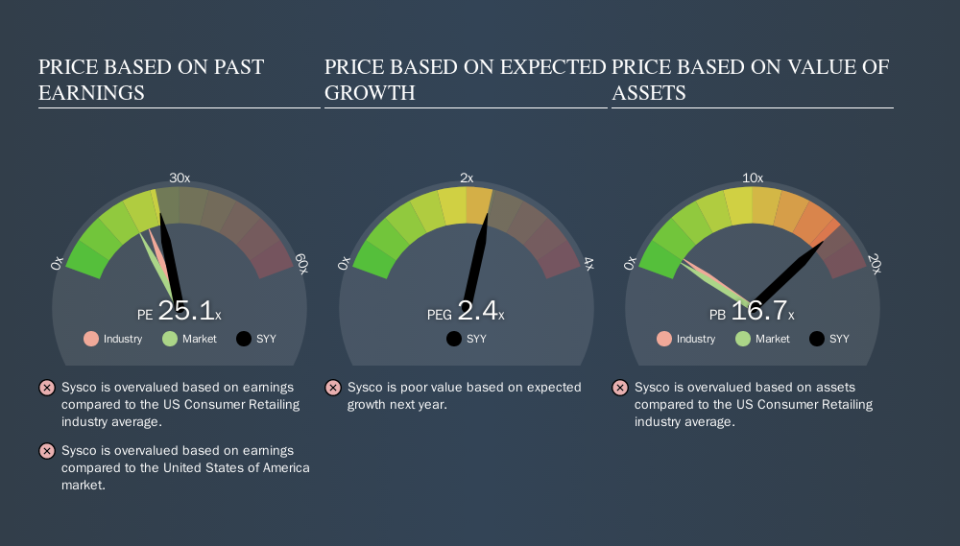
This article is for investors who would like to improve their understanding of price to earnings ratios (P/E ratios). We'll look at Sysco Corporation's (NYSE:SYY) P/E ratio and reflect on what it tells us about the company's share price. Sysco has a price to earnings ratio of 25.09, based on the last twelve months. That is equivalent to an earnings yield of about 4.0%.
See our latest analysis for Sysco
How Do I Calculate Sysco's Price To Earnings Ratio?
The formula for P/E is:
Price to Earnings Ratio = Price per Share ÷ Earnings per Share (EPS)
Or for Sysco:
P/E of 25.09 = $81.28 ÷ $3.24 (Based on the trailing twelve months to June 2019.)
Is A High Price-to-Earnings Ratio Good?
A higher P/E ratio implies that investors pay a higher price for the earning power of the business. All else being equal, it's better to pay a low price -- but as Warren Buffett said, 'It's far better to buy a wonderful company at a fair price than a fair company at a wonderful price.
How Does Sysco's P/E Ratio Compare To Its Peers?
One good way to get a quick read on what market participants expect of a company is to look at its P/E ratio. The image below shows that Sysco has a higher P/E than the average (21.0) P/E for companies in the consumer retailing industry.
That means that the market expects Sysco will outperform other companies in its industry. Clearly the market expects growth, but it isn't guaranteed. So investors should delve deeper. I like to check if company insiders have been buying or selling.
How Growth Rates Impact P/E Ratios
Probably the most important factor in determining what P/E a company trades on is the earnings growth. That's because companies that grow earnings per share quickly will rapidly increase the 'E' in the equation. That means unless the share price increases, the P/E will reduce in a few years. And as that P/E ratio drops, the company will look cheap, unless its share price increases.
It's great to see that Sysco grew EPS by 19% in the last year. And earnings per share have improved by 15% annually, over the last five years. So one might expect an above average P/E ratio.
Remember: P/E Ratios Don't Consider The Balance Sheet
The 'Price' in P/E reflects the market capitalization of the company. That means it doesn't take debt or cash into account. Hypothetically, a company could reduce its future P/E ratio by spending its cash (or taking on debt) to achieve higher earnings.
While growth expenditure doesn't always pay off, the point is that it is a good option to have; but one that the P/E ratio ignores.
Sysco's Balance Sheet
Net debt totals 18% of Sysco's market cap. It would probably deserve a higher P/E ratio if it was net cash, since it would have more options for growth.
The Verdict On Sysco's P/E Ratio
Sysco trades on a P/E ratio of 25.1, which is above its market average of 18.1. Its debt levels do not imperil its balance sheet and it is growing EPS strongly. So on this analysis it seems reasonable that its P/E ratio is above average.
Investors should be looking to buy stocks that the market is wrong about. People often underestimate remarkable growth -- so investors can make money when fast growth is not fully appreciated. So this free visualization of the analyst consensus on future earnings could help you make the right decision about whether to buy, sell, or hold.
You might be able to find a better buy than Sysco. If you want a selection of possible winners, check out this free list of interesting companies that trade on a P/E below 20 (but have proven they can grow earnings).
We aim to bring you long-term focused research analysis driven by fundamental data. Note that our analysis may not factor in the latest price-sensitive company announcements or qualitative material.
If you spot an error that warrants correction, please contact the editor at editorial-team@simplywallst.com. This article by Simply Wall St is general in nature. It does not constitute a recommendation to buy or sell any stock, and does not take account of your objectives, or your financial situation. Simply Wall St has no position in the stocks mentioned. Thank you for reading.
