
 Yahoo Finance
 Don't Sell Northland Power Inc. (TSE:NPI) Before You Read This

Want to participate in a short research study? Help shape the future of investing tools and you could win a $250 gift card!
This article is written for those who want to get better at using price to earnings ratios (P/E ratios). We'll look at Northland Power Inc.'s (TSE:NPI) P/E ratio and reflect on what it tells us about the company's share price. Northland Power has a price to earnings ratio of 14.85, based on the last twelve months. That is equivalent to an earnings yield of about 6.7%.
Check out our latest analysis for Northland Power
How Do You Calculate A P/E Ratio?
The formula for price to earnings is:
Price to Earnings Ratio = Share Price ÷ Earnings per Share (EPS)
Or for Northland Power:
P/E of 14.85 = CA$24.84 ÷ CA$1.67 (Based on the trailing twelve months to March 2019.)
Is A High Price-to-Earnings Ratio Good?
A higher P/E ratio means that buyers have to pay a higher price for each CA$1 the company has earned over the last year. That is not a good or a bad thing per se, but a high P/E does imply buyers are optimistic about the future.
How Growth Rates Impact P/E Ratios
Probably the most important factor in determining what P/E a company trades on is the earnings growth. If earnings are growing quickly, then the 'E' in the equation will increase faster than it would otherwise. Therefore, even if you pay a high multiple of earnings now, that multiple will become lower in the future. And as that P/E ratio drops, the company will look cheap, unless its share price increases.
Notably, Northland Power grew EPS by a whopping 43% in the last year. And it has bolstered its earnings per share by 11% per year over the last five years. So we'd generally expect it to have a relatively high P/E ratio.
How Does Northland Power's P/E Ratio Compare To Its Peers?
We can get an indication of market expectations by looking at the P/E ratio. As you can see below, Northland Power has a higher P/E than the average company (13.5) in the renewable energy industry.
Its relatively high P/E ratio indicates that Northland Power shareholders think it will perform better than other companies in its industry classification. The market is optimistic about the future, but that doesn't guarantee future growth. So investors should always consider the P/E ratio alongside other factors, such as whether company directors have been buying shares.
Remember: P/E Ratios Don't Consider The Balance Sheet
Don't forget that the P/E ratio considers market capitalization. In other words, it does not consider any debt or cash that the company may have on the balance sheet. Theoretically, a business can improve its earnings (and produce a lower P/E in the future) by investing in growth. That means taking on debt (or spending its cash).
Such spending might be good or bad, overall, but the key point here is that you need to look at debt to understand the P/E ratio in context.
How Does Northland Power's Debt Impact Its P/E Ratio?
Northland Power has net debt worth a very significant 163% of its market capitalization. If you want to compare its P/E ratio to other companies, you must keep in mind that these debt levels would usually warrant a relatively low P/E.
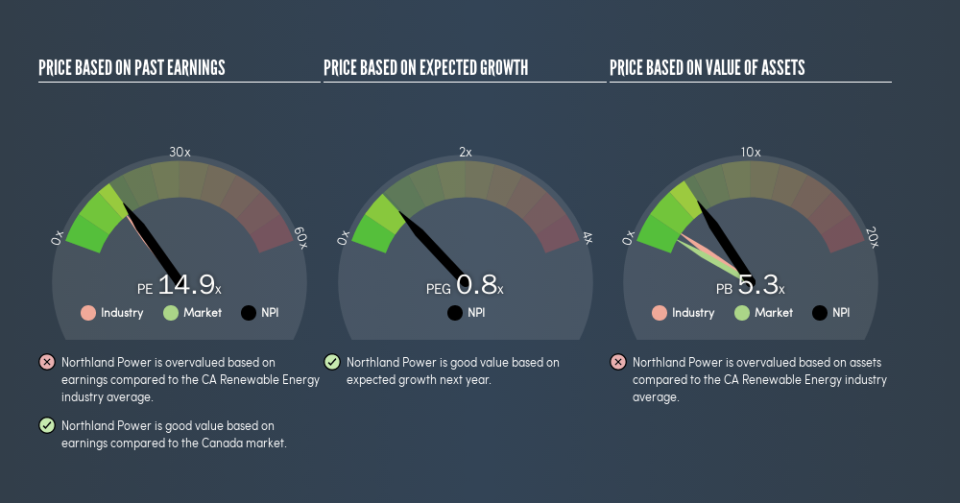
The Bottom Line On Northland Power's P/E Ratio
Northland Power trades on a P/E ratio of 14.9, which is fairly close to the CA market average of 15. While it does have meaningful debt levels, it has also produced strong earnings growth recently. The P/E suggests the market isn't confident that growth will be sustained, though.
Investors have an opportunity when market expectations about a stock are wrong. If it is underestimating a company, investors can make money by buying and holding the shares until the market corrects itself. So this free visualization of the analyst consensus on future earnings could help you make the right decision about whether to buy, sell, or hold.
You might be able to find a better buy than Northland Power. If you want a selection of possible winners, check out this free list of interesting companies that trade on a P/E below 20 (but have proven they can grow earnings).
We aim to bring you long-term focused research analysis driven by fundamental data. Note that our analysis may not factor in the latest price-sensitive company announcements or qualitative material.
If you spot an error that warrants correction, please contact the editor at editorial-team@simplywallst.com. This article by Simply Wall St is general in nature. It does not constitute a recommendation to buy or sell any stock, and does not take account of your objectives, or your financial situation. Simply Wall St has no position in the stocks mentioned. Thank you for reading.