
 Yahoo Finance
 Don't Sell Great Wall Motor Company Limited (HKG:2333) Before You Read This

This article is written for those who want to get better at using price to earnings ratios (P/E ratios). To keep it practical, we'll show how Great Wall Motor Company Limited's (HKG:2333) P/E ratio could help you assess the value on offer. Great Wall Motor has a price to earnings ratio of 10.59, based on the last twelve months. In other words, at today's prices, investors are paying HK$10.59 for every HK$1 in prior year profit.
View our latest analysis for Great Wall Motor
How Do You Calculate Great Wall Motor's P/E Ratio?
The formula for price to earnings is:
Price to Earnings Ratio = Share Price (in reporting currency) ÷ Earnings per Share (EPS)
Or for Great Wall Motor:
P/E of 10.59 = CN¥4.52 (Note: this is the share price in the reporting currency, namely, CNY ) ÷ CN¥0.43 (Based on the trailing twelve months to March 2019.)
Is A High Price-to-Earnings Ratio Good?
A higher P/E ratio means that buyers have to pay a higher price for each HK$1 the company has earned over the last year. All else being equal, it's better to pay a low price -- but as Warren Buffett said, 'It's far better to buy a wonderful company at a fair price than a fair company at a wonderful price.'
Does Great Wall Motor Have A Relatively High Or Low P/E For Its Industry?
The P/E ratio essentially measures market expectations of a company. The image below shows that Great Wall Motor has a higher P/E than the average (9.3) P/E for companies in the auto industry.
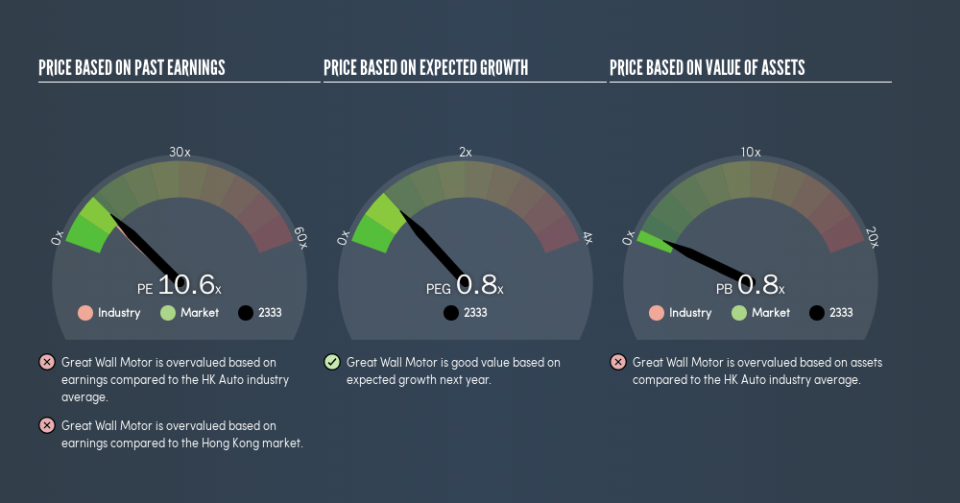
That means that the market expects Great Wall Motor will outperform other companies in its industry. The market is optimistic about the future, but that doesn't guarantee future growth. So further research is always essential. I often monitor director buying and selling.
How Growth Rates Impact P/E Ratios
If earnings fall then in the future the 'E' will be lower. That means unless the share price falls, the P/E will increase in a few years. A higher P/E should indicate the stock is expensive relative to others -- and that may encourage shareholders to sell.
Great Wall Motor saw earnings per share decrease by 24% last year. And it has shrunk its earnings per share by 14% per year over the last five years. This could justify a pessimistic P/E.
Don't Forget: The P/E Does Not Account For Debt or Bank Deposits
One drawback of using a P/E ratio is that it considers market capitalization, but not the balance sheet. In other words, it does not consider any debt or cash that the company may have on the balance sheet. The exact same company would hypothetically deserve a higher P/E ratio if it had a strong balance sheet, than if it had a weak one with lots of debt, because a cashed up company can spend on growth.
Such spending might be good or bad, overall, but the key point here is that you need to look at debt to understand the P/E ratio in context.
How Does Great Wall Motor's Debt Impact Its P/E Ratio?
Great Wall Motor's net debt is 15% of its market cap. It would probably deserve a higher P/E ratio if it was net cash, since it would have more options for growth.
The Verdict On Great Wall Motor's P/E Ratio
Great Wall Motor has a P/E of 10.6. That's around the same as the average in the HK market, which is 10. With modest debt, and a lack of recent growth, it would seem the market is expecting improvement in earnings.
When the market is wrong about a stock, it gives savvy investors an opportunity. As value investor Benjamin Graham famously said, 'In the short run, the market is a voting machine but in the long run, it is a weighing machine.' So this free visual report on analyst forecasts could hold the key to an excellent investment decision.
Of course you might be able to find a better stock than Great Wall Motor. So you may wish to see this free collection of other companies that have grown earnings strongly.
We aim to bring you long-term focused research analysis driven by fundamental data. Note that our analysis may not factor in the latest price-sensitive company announcements or qualitative material.
If you spot an error that warrants correction, please contact the editor at editorial-team@simplywallst.com. This article by Simply Wall St is general in nature. It does not constitute a recommendation to buy or sell any stock, and does not take account of your objectives, or your financial situation. Simply Wall St has no position in the stocks mentioned. Thank you for reading.
