
 Yahoo Finance
 Don't Sell GP Strategies Corporation (NYSE:GPX) Before You Read This

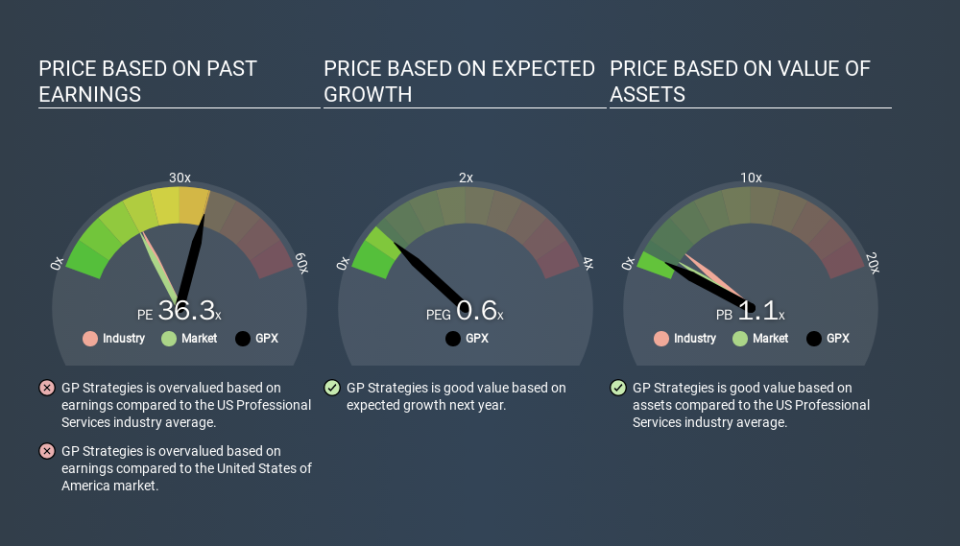
This article is for investors who would like to improve their understanding of price to earnings ratios (P/E ratios). We'll show how you can use GP Strategies Corporation's (NYSE:GPX) P/E ratio to inform your assessment of the investment opportunity. Based on the last twelve months, GP Strategies's P/E ratio is 36.34. That is equivalent to an earnings yield of about 2.8%.
View our latest analysis for GP Strategies
How Do You Calculate A P/E Ratio?
The formula for P/E is:
Price to Earnings Ratio = Share Price ÷ Earnings per Share (EPS)
Or for GP Strategies:
P/E of 36.34 = USD13.17 ÷ USD0.36 (Based on the year to September 2019.)
Is A High Price-to-Earnings Ratio Good?
A higher P/E ratio implies that investors pay a higher price for the earning power of the business. That isn't necessarily good or bad, but a high P/E implies relatively high expectations of what a company can achieve in the future.
How Does GP Strategies's P/E Ratio Compare To Its Peers?
The P/E ratio essentially measures market expectations of a company. As you can see below, GP Strategies has a higher P/E than the average company (18.8) in the professional services industry.
GP Strategies's P/E tells us that market participants think the company will perform better than its industry peers, going forward. Shareholders are clearly optimistic, but the future is always uncertain. So further research is always essential. I often monitor director buying and selling.
How Growth Rates Impact P/E Ratios
When earnings fall, the 'E' decreases, over time. That means unless the share price falls, the P/E will increase in a few years. Then, a higher P/E might scare off shareholders, pushing the share price down.
GP Strategies saw earnings per share decrease by 34% last year. And EPS is down 24% a year, over the last 5 years. This could justify a pessimistic P/E.
A Limitation: P/E Ratios Ignore Debt and Cash In The Bank
One drawback of using a P/E ratio is that it considers market capitalization, but not the balance sheet. So it won't reflect the advantage of cash, or disadvantage of debt. Theoretically, a business can improve its earnings (and produce a lower P/E in the future) by investing in growth. That means taking on debt (or spending its cash).
While growth expenditure doesn't always pay off, the point is that it is a good option to have; but one that the P/E ratio ignores.
So What Does GP Strategies's Balance Sheet Tell Us?
Net debt is 47% of GP Strategies's market cap. While it's worth keeping this in mind, it isn't a worry.
The Bottom Line On GP Strategies's P/E Ratio
GP Strategies's P/E is 36.3 which is above average (17.7) in its market. With some debt but no EPS growth last year, the market has high expectations of future profits.
Investors have an opportunity when market expectations about a stock are wrong. If the reality for a company is better than it expects, you can make money by buying and holding for the long term. So this free report on the analyst consensus forecasts could help you make a master move on this stock.
Of course, you might find a fantastic investment by looking at a few good candidates. So take a peek at this free list of companies with modest (or no) debt, trading on a P/E below 20.
If you spot an error that warrants correction, please contact the editor at editorial-team@simplywallst.com. This article by Simply Wall St is general in nature. It does not constitute a recommendation to buy or sell any stock, and does not take account of your objectives, or your financial situation. Simply Wall St has no position in the stocks mentioned.
We aim to bring you long-term focused research analysis driven by fundamental data. Note that our analysis may not factor in the latest price-sensitive company announcements or qualitative material. Thank you for reading.
