
 Yahoo Finance
 Don't Sell Enbridge Inc. (TSE:ENB) Before You Read This

This article is written for those who want to get better at using price to earnings ratios (P/E ratios). We'll look at Enbridge Inc.'s (TSE:ENB) P/E ratio and reflect on what it tells us about the company's share price. What is Enbridge's P/E ratio? Well, based on the last twelve months it is 34.18. That is equivalent to an earnings yield of about 2.9%.
Check out our latest analysis for Enbridge
How Do You Calculate Enbridge's P/E Ratio?
The formula for P/E is:
Price to Earnings Ratio = Price per Share ÷ Earnings per Share (EPS)
Or for Enbridge:
P/E of 34.18 = CA$49.86 ÷ CA$1.46 (Based on the year to December 2018.)
Is A High P/E Ratio Good?
The higher the P/E ratio, the higher the price tag of a business, relative to its trailing earnings. That is not a good or a bad thing per se, but a high P/E does imply buyers are optimistic about the future.
How Growth Rates Impact P/E Ratios
Generally speaking the rate of earnings growth has a profound impact on a company's P/E multiple. That's because companies that grow earnings per share quickly will rapidly increase the 'E' in the equation. That means even if the current P/E is high, it will reduce over time if the share price stays flat. Then, a lower P/E should attract more buyers, pushing the share price up.
Enbridge shrunk earnings per share by 12% over the last year. But it has grown its earnings per share by 22% per year over the last five years.
How Does Enbridge's P/E Ratio Compare To Its Peers?
The P/E ratio essentially measures market expectations of a company. As you can see below, Enbridge has a higher P/E than the average company (15.4) in the oil and gas industry.
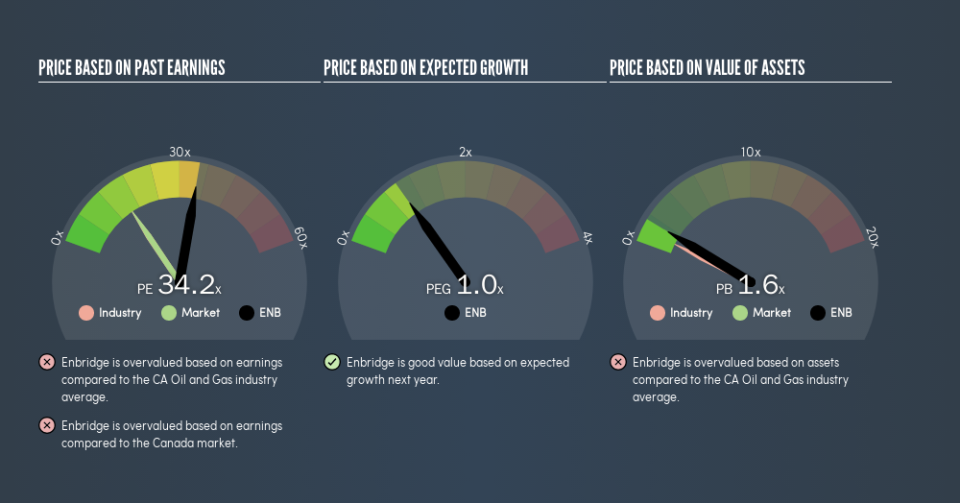
That means that the market expects Enbridge will outperform other companies in its industry. Shareholders are clearly optimistic, but the future is always uncertain. So investors should delve deeper. I like to check if company insiders have been buying or selling.
A Limitation: P/E Ratios Ignore Debt and Cash In The Bank
It's important to note that the P/E ratio considers the market capitalization, not the enterprise value. That means it doesn't take debt or cash into account. In theory, a company can lower its future P/E ratio by using cash or debt to invest in growth.
Such expenditure might be good or bad, in the long term, but the point here is that the balance sheet is not reflected by this ratio.
Is Debt Impacting Enbridge's P/E?
Net debt totals 64% of Enbridge's market cap. This is a reasonably significant level of debt -- all else being equal you'd expect a much lower P/E than if it had net cash.
The Bottom Line On Enbridge's P/E Ratio
Enbridge has a P/E of 34.2. That's higher than the average in the CA market, which is 15.5. With relatively high debt, and no earnings per share growth over twelve months, it's safe to say the market believes the company will improve its earnings growth in the future.
Investors have an opportunity when market expectations about a stock are wrong. As value investor Benjamin Graham famously said, 'In the short run, the market is a voting machine but in the long run, it is a weighing machine.' So this free visualization of the analyst consensus on future earnings could help you make the right decision about whether to buy, sell, or hold.
Of course, you might find a fantastic investment by looking at a few good candidates. So take a peek at this free list of companies with modest (or no) debt, trading on a P/E below 20.
We aim to bring you long-term focused research analysis driven by fundamental data. Note that our analysis may not factor in the latest price-sensitive company announcements or qualitative material.
If you spot an error that warrants correction, please contact the editor at editorial-team@simplywallst.com. This article by Simply Wall St is general in nature. It does not constitute a recommendation to buy or sell any stock, and does not take account of your objectives, or your financial situation. Simply Wall St has no position in the stocks mentioned. Thank you for reading.
