
 Yahoo Finance
 Don't Sell Dollarama Inc. (TSE:DOL) Before You Read This

The goal of this article is to teach you how to use price to earnings ratios (P/E ratios). To keep it practical, we'll show how Dollarama Inc.'s (TSE:DOL) P/E ratio could help you assess the value on offer. Based on the last twelve months, Dollarama's P/E ratio is 21.45. That means that at current prices, buyers pay CA$21.45 for every CA$1 in trailing yearly profits.
View our latest analysis for Dollarama
How Do You Calculate Dollarama's P/E Ratio?
The formula for P/E is:
Price to Earnings Ratio = Share Price ÷ Earnings per Share (EPS)
Or for Dollarama:
P/E of 21.45 = CAD38.11 ÷ CAD1.78 (Based on the trailing twelve months to November 2019.)
Is A High Price-to-Earnings Ratio Good?
The higher the P/E ratio, the higher the price tag of a business, relative to its trailing earnings. That isn't necessarily good or bad, but a high P/E implies relatively high expectations of what a company can achieve in the future.
How Does Dollarama's P/E Ratio Compare To Its Peers?
The P/E ratio indicates whether the market has higher or lower expectations of a company. The image below shows that Dollarama has a higher P/E than the average (11.2) P/E for companies in the multiline retail industry.
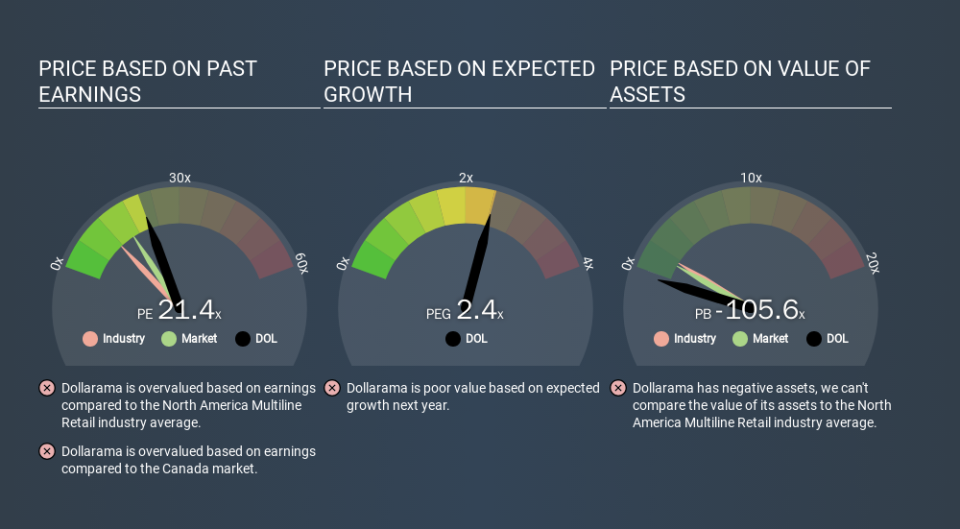
That means that the market expects Dollarama will outperform other companies in its industry. The market is optimistic about the future, but that doesn't guarantee future growth. So investors should always consider the P/E ratio alongside other factors, such as whether company directors have been buying shares.
How Growth Rates Impact P/E Ratios
Earnings growth rates have a big influence on P/E ratios. Earnings growth means that in the future the 'E' will be higher. Therefore, even if you pay a high multiple of earnings now, that multiple will become lower in the future. Then, a lower P/E should attract more buyers, pushing the share price up.
Dollarama saw earnings per share improve by -8.5% last year. And its annual EPS growth rate over 5 years is 21%.
Remember: P/E Ratios Don't Consider The Balance Sheet
One drawback of using a P/E ratio is that it considers market capitalization, but not the balance sheet. So it won't reflect the advantage of cash, or disadvantage of debt. In theory, a company can lower its future P/E ratio by using cash or debt to invest in growth.
Spending on growth might be good or bad a few years later, but the point is that the P/E ratio does not account for the option (or lack thereof).
Is Debt Impacting Dollarama's P/E?
Dollarama has net debt worth 15% of its market capitalization. That's enough debt to impact the P/E ratio a little; so keep it in mind if you're comparing it to companies without debt.
The Verdict On Dollarama's P/E Ratio
Dollarama's P/E is 21.4 which is above average (15.4) in its market. With debt at prudent levels and improving earnings, it's fair to say the market expects steady progress in the future.
Investors should be looking to buy stocks that the market is wrong about. If the reality for a company is better than it expects, you can make money by buying and holding for the long term. So this free visual report on analyst forecasts could hold the key to an excellent investment decision.
Of course you might be able to find a better stock than Dollarama. So you may wish to see this free collection of other companies that have grown earnings strongly.
If you spot an error that warrants correction, please contact the editor at editorial-team@simplywallst.com. This article by Simply Wall St is general in nature. It does not constitute a recommendation to buy or sell any stock, and does not take account of your objectives, or your financial situation. Simply Wall St has no position in the stocks mentioned.
We aim to bring you long-term focused research analysis driven by fundamental data. Note that our analysis may not factor in the latest price-sensitive company announcements or qualitative material. Thank you for reading.
