
 Yahoo Finance
 Domino's Pizza Group's (LON:DOM) earnings growth rate lags the 6.8% CAGR delivered to shareholders
Stock pickers are generally looking for stocks that will outperform the broader market. And the truth is, you can make significant gains if you buy good quality businesses at the right price. For example, long term Domino's Pizza Group plc (LON:DOM) shareholders have enjoyed a 19% share price rise over the last half decade, well in excess of the market return of around 0.1% (not including dividends). On the other hand, the more recent gains haven't been so impressive, with shareholders gaining just 16% , including dividends .
Since the long term performance has been good but there's been a recent pullback of 4.8%, let's check if the fundamentals match the share price.
See our latest analysis for Domino's Pizza Group
There is no denying that markets are sometimes efficient, but prices do not always reflect underlying business performance. One way to examine how market sentiment has changed over time is to look at the interaction between a company's share price and its earnings per share (EPS).
Over half a decade, Domino's Pizza Group managed to grow its earnings per share at 12% a year. This EPS growth is higher than the 4% average annual increase in the share price. So one could conclude that the broader market has become more cautious towards the stock. The reasonably low P/E ratio of 11.08 also suggests market apprehension.
You can see below how EPS has changed over time (discover the exact values by clicking on the image).
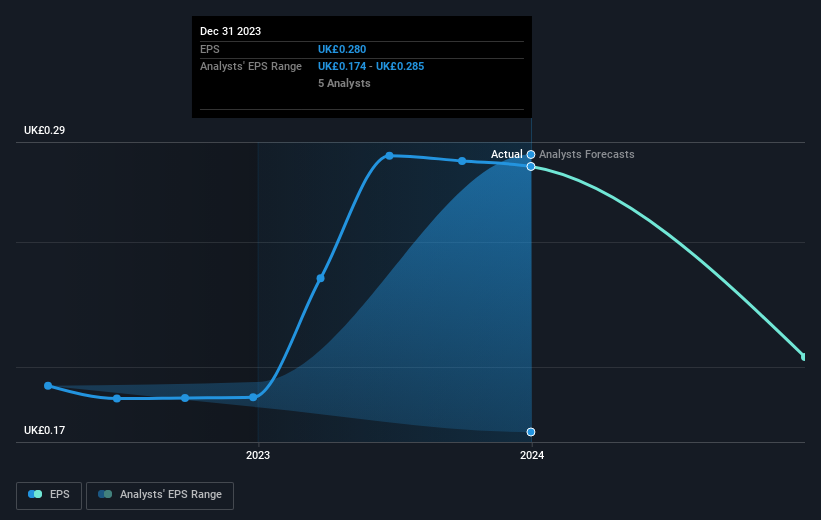
We know that Domino's Pizza Group has improved its bottom line lately, but is it going to grow revenue? You could check out this free report showing analyst revenue forecasts.
What About Dividends?
As well as measuring the share price return, investors should also consider the total shareholder return (TSR). Whereas the share price return only reflects the change in the share price, the TSR includes the value of dividends (assuming they were reinvested) and the benefit of any discounted capital raising or spin-off. So for companies that pay a generous dividend, the TSR is often a lot higher than the share price return. In the case of Domino's Pizza Group, it has a TSR of 39% for the last 5 years. That exceeds its share price return that we previously mentioned. The dividends paid by the company have thusly boosted the total shareholder return.
A Different Perspective
We're pleased to report that Domino's Pizza Group shareholders have received a total shareholder return of 16% over one year. And that does include the dividend. That gain is better than the annual TSR over five years, which is 7%. Therefore it seems like sentiment around the company has been positive lately. Someone with an optimistic perspective could view the recent improvement in TSR as indicating that the business itself is getting better with time. While it is well worth considering the different impacts that market conditions can have on the share price, there are other factors that are even more important. Case in point: We've spotted 4 warning signs for Domino's Pizza Group you should be aware of, and 1 of them is a bit concerning.
If you would prefer to check out another company -- one with potentially superior financials -- then do not miss this free list of companies that have proven they can grow earnings.
Please note, the market returns quoted in this article reflect the market weighted average returns of stocks that currently trade on British exchanges.
Have feedback on this article? Concerned about the content? Get in touch with us directly. Alternatively, email editorial-team (at) simplywallst.com.
This article by Simply Wall St is general in nature. We provide commentary based on historical data and analyst forecasts only using an unbiased methodology and our articles are not intended to be financial advice. It does not constitute a recommendation to buy or sell any stock, and does not take account of your objectives, or your financial situation. We aim to bring you long-term focused analysis driven by fundamental data. Note that our analysis may not factor in the latest price-sensitive company announcements or qualitative material. Simply Wall St has no position in any stocks mentioned.
