
 Yahoo Finance
 Doman Building Materials Group (TSE:DBM) Is Doing The Right Things To Multiply Its Share Price
To find a multi-bagger stock, what are the underlying trends we should look for in a business? In a perfect world, we'd like to see a company investing more capital into its business and ideally the returns earned from that capital are also increasing. This shows us that it's a compounding machine, able to continually reinvest its earnings back into the business and generate higher returns. With that in mind, we've noticed some promising trends at Doman Building Materials Group (TSE:DBM) so let's look a bit deeper.
What Is Return On Capital Employed (ROCE)?
Just to clarify if you're unsure, ROCE is a metric for evaluating how much pre-tax income (in percentage terms) a company earns on the capital invested in its business. The formula for this calculation on Doman Building Materials Group is:
Return on Capital Employed = Earnings Before Interest and Tax (EBIT) ÷ (Total Assets - Current Liabilities)
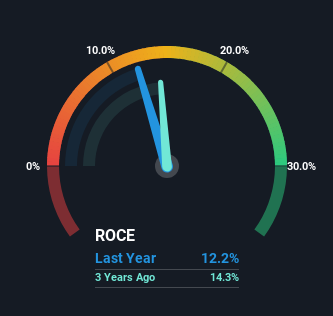
0.12 = CA$128m ÷ (CA$1.4b - CA$377m) (Based on the trailing twelve months to December 2023).
Thus, Doman Building Materials Group has an ROCE of 12%. In absolute terms, that's a pretty normal return, and it's somewhat close to the Trade Distributors industry average of 14%.
View our latest analysis for Doman Building Materials Group
In the above chart we have measured Doman Building Materials Group's prior ROCE against its prior performance, but the future is arguably more important. If you're interested, you can view the analysts predictions in our free analyst report for Doman Building Materials Group .
The Trend Of ROCE
Investors would be pleased with what's happening at Doman Building Materials Group. The numbers show that in the last five years, the returns generated on capital employed have grown considerably to 12%. Basically the business is earning more per dollar of capital invested and in addition to that, 55% more capital is being employed now too. So we're very much inspired by what we're seeing at Doman Building Materials Group thanks to its ability to profitably reinvest capital.
For the record though, there was a noticeable increase in the company's current liabilities over the period, so we would attribute some of the ROCE growth to that. Effectively this means that suppliers or short-term creditors are now funding 26% of the business, which is more than it was five years ago. It's worth keeping an eye on this because as the percentage of current liabilities to total assets increases, some aspects of risk also increase.
The Bottom Line
To sum it up, Doman Building Materials Group has proven it can reinvest in the business and generate higher returns on that capital employed, which is terrific. And a remarkable 149% total return over the last five years tells us that investors are expecting more good things to come in the future. With that being said, we still think the promising fundamentals mean the company deserves some further due diligence.
Doman Building Materials Group does have some risks though, and we've spotted 2 warning signs for Doman Building Materials Group that you might be interested in.
While Doman Building Materials Group may not currently earn the highest returns, we've compiled a list of companies that currently earn more than 25% return on equity. Check out this free list here.
Have feedback on this article? Concerned about the content? Get in touch with us directly. Alternatively, email editorial-team (at) simplywallst.com.
This article by Simply Wall St is general in nature. We provide commentary based on historical data and analyst forecasts only using an unbiased methodology and our articles are not intended to be financial advice. It does not constitute a recommendation to buy or sell any stock, and does not take account of your objectives, or your financial situation. We aim to bring you long-term focused analysis driven by fundamental data. Note that our analysis may not factor in the latest price-sensitive company announcements or qualitative material. Simply Wall St has no position in any stocks mentioned.
