
 Yahoo Finance
 Dollar Tree (DLTR) Q1 Earnings Miss Estimates, Shares Slump
Dollar Tree, Inc. DLTR has reported first-quarter fiscal 2023 results, wherein earnings missed the Zacks Consensus Estimate, while sales beat. Moreover, the top line improved year over year, while earnings declined. The top line has benefited from the continued demand for the company’s products. This was offset by an unfavorable product mix, driven by the demand shift toward low-margin consumable goods, which hurt the bottom line.
Despite the strong sales trends across both banners, the company expects the increased demand for consumables and inflationary costs to affect margins and the bottom line in the near term.
Shares of DLTR declined 12.1% in the pre-market trading session on May 25. Despite top-line growth in the first quarter of fiscal 2023, ongoing cost pressures hurt earnings. The Zacks Rank #3 (Hold) stock has rallied 8% in the past three months against the industry’s decline of 2.9%.
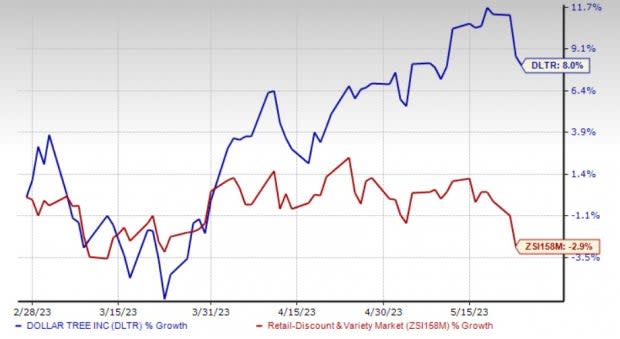
Image Source: Zacks Investment Research
Quarter in Detail
Dollar Tree’s earnings declined 38% year over year to $1.47 per share and missed the Zacks Consensus Estimate of $1.51. The bottom-line decline can be attributed to the external pressures affecting all of retail, mainly the margin impact of elevated shrink and the product mix shift to consumables.
Consolidated net sales advanced 6.1% year over year to $7,323.8 million and surpassed the Zacks Consensus Estimate of $7,274 million. Enterprise same-store sales (comps) improved 4.8% year over year. For the Dollar Tree banner, comps were up 3.4%, while the same for the Family Dollar banner improved 6.6%.
Enterprise comps were slightly ahead of our estimate of 4.3% growth. Our model predicted comps growth of 2.5% for the Dollar Tree banner and 6% for Family Dollar.
Comps at both segments benefited from a mid-single-digit percent increase in comp traffic. The Dollar Tree segment benefited from a 5.5% increase in average ticket, partly negated by a 2.1% decline in traffic. Comps at Family Dollar were aided by a 4.3% increase in traffic and a 2.2% rise in average ticket.
Dollar Tree, Inc. Price, Consensus and EPS Surprise
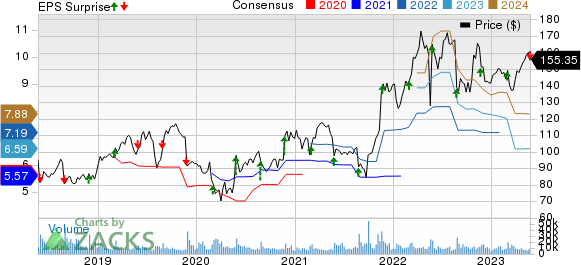
Dollar Tree, Inc. price-consensus-eps-surprise-chart | Dollar Tree, Inc. Quote
The gross profit declined 4.7% year over year to $2,230.4 million, while the gross margin contracted 340 basis points (bps) to 30.5%. Lower initial mark-on, an unfavorable sales mix and shrink affected gross margin. This was partly negated by lower freight costs. The decline also resulted from outsized margin gain in the prior quarter from the initial transition to the $1.25 price point at Dollar Tree. The gross margin contracted 530 bps to 35.3% at the Dollar Tree banner and 100 bps to 24.8% at the Family Dollar segment.
Selling, general and administrative (SG&A) expenses, as a percentage of sales, increased 150 bps to 24.8%. SG&A expenses included a $30-million charge related to its legal reserve for the Family Dollar distribution facility in Arkansas. Excluding this charge, the SG&A expense rate was 24.4% in the quarter. The increase mainly reflected higher store and field payroll costs, elevated expenditures for repairs and maintenance to improve store standards, and professional fees. This was partially offset by comparable store net sales leverage.
While the operating income declined 42.6% to $419.7 million, the operating margin declined 490 bps to 5.7%. Adjusted operating income declined 38.5% year over year to $449.7 million. Segment-wise, the operating margin declined 660 bps to 13.6% for Dollar Tree. Meanwhile, the Family Dollar segment reported an adjusted operating income of $38.8 million compared with $89.5 million in the year-ago quarter.
Balance Sheet
Dollar Tree ended the fiscal first quarter with cash and cash equivalents of $872.8 million. As of Apr 29, 2023, net merchandise inventories increased to $5,112 million from $4,801.1 million in the year-ago period. It had net long-term debt of $3,422.7 million and shareholders’ equity of $8,899.7 million as of Apr 30, 2023.
The company bought back 1,025,000 shares for $151.1 million in first-quarter fiscal 2023. As of Apr 30, 2023, Dollar Tree had $1.7 billion remaining under its existing authorization.
Store Update
In first-quarter fiscal 2023, Dollar Tree opened 107 stores, relocated 33 outlets and shuttered 29 stores. The company completed the renovation of 252 Family Dollar stores. Additionally, it expanded the multi-price plus offerings to another 408 Dollar Tree stores in the quarter. As of Apr 30, 2023, the company operated 16,419 stores in 48 states and five Canada provinces.
Guidance
For fiscal 2023, Dollar Tree expects consolidated net sales of $30-$30.5 billion. The company anticipates comps growth of low to mid-single digits in fiscal 2023, with comp growth of low to mid-single digits at Dollar Tree and a mid-single-digit increase in the Family Dollar segment. Selling square footage is likely to rise 3-3.5% for fiscal 2023, with new store growth expected to be weighted toward the latter part of the year.
Management expects earnings per share (EPS) of $5.73-$6.13 (including a 29-cent contribution from the 53rd week and a 12-cent charge for the legal reserve) for fiscal 2023.
For second-quarter fiscal 2023, the company expects consolidated net sales of $7-$7.2 billion based on a mid-single-digit comp growth for the enterprise. Comp sales are also expected to improve in the mid-single digits at Dollar Tree and Family Dollar. EPS is estimated at 79-89 cents for the fiscal second quarter.
Stocks to Consider
Here we highlighted three better-ranked stocks, namely The TJX Companies TJX, Fastenal FAST and Kroger KR.
TJX Companies is a leading off-price retailer of apparel and home fashions in the U.S. and worldwide. The stock currently carries a Zacks Rank #2 (Buy). You can see the complete list of today’s Zacks #1 (Strong Buy) Rank stocks here.
The Zacks Consensus Estimate for TJX’s current financial-year revenues and earnings per share suggests growth of 6.4% and 14.5%, respectively, from the year-ago reported figures. TJX has a trailing four-quarter earnings surprise of 4.4%, on average.
Fastenal is a national wholesale distributor of industrial and construction supplies. FAST has a Zacks Rank #2 at present.
The Zacks Consensus Estimate for Fastenal’s current financial-year sales and EPS suggests growth of 5.4% and 4.8%, respectively, from the year-ago reported figures. FAST has a trailing four-quarter earnings surprise of 3.2%, on average.
Kroger, which operates in the thin-margin grocery industry, carries a Zacks Rank of 2 at present. KR’s current financial-year revenues and EPS estimates suggest growth of 2.5% and 6.6%, respectively, from the year-ago reported figures.
KR gave an earnings surprise of 10% in the last reported quarter. KR has a trailing four-quarter earnings surprise of 9.8%, on average.
Want the latest recommendations from Zacks Investment Research? Today, you can download 7 Best Stocks for the Next 30 Days. Click to get this free report
The TJX Companies, Inc. (TJX) : Free Stock Analysis Report
Fastenal Company (FAST) : Free Stock Analysis Report
Dollar Tree, Inc. (DLTR) : Free Stock Analysis Report
The Kroger Co. (KR) : Free Stock Analysis Report
