
 Yahoo Finance
 Does WSP Global Inc.’s (TSE:WSP) ROCE Reflect Well On The Business?

Today we are going to look at WSP Global Inc. (TSE:WSP) to see whether it might be an attractive investment prospect. To be precise, we'll consider its Return On Capital Employed (ROCE), as that will inform our view of the quality of the business.
Firstly, we'll go over how we calculate ROCE. Second, we'll look at its ROCE compared to similar companies. Then we'll determine how its current liabilities are affecting its ROCE.
Understanding Return On Capital Employed (ROCE)
ROCE measures the 'return' (pre-tax profit) a company generates from capital employed in its business. In general, businesses with a higher ROCE are usually better quality. Overall, it is a valuable metric that has its flaws. Renowned investment researcher Michael Mauboussin has suggested that a high ROCE can indicate that 'one dollar invested in the company generates value of more than one dollar'.
So, How Do We Calculate ROCE?
Analysts use this formula to calculate return on capital employed:
Return on Capital Employed = Earnings Before Interest and Tax (EBIT) ÷ (Total Assets - Current Liabilities)
Or for WSP Global:
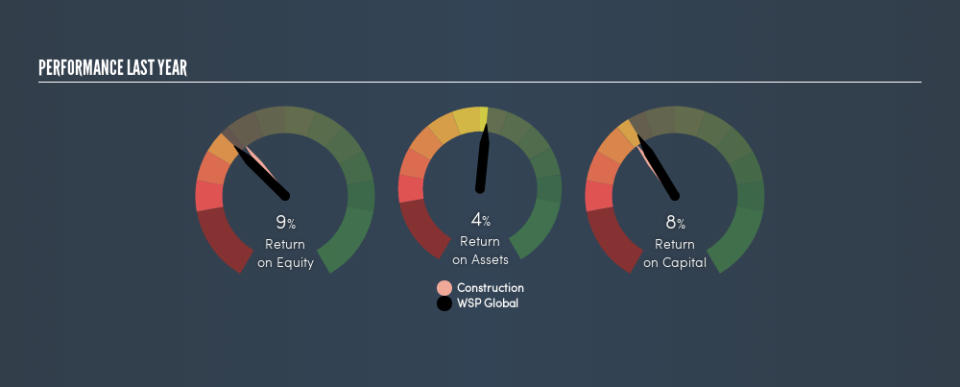
0.083 = CA$501m ÷ (CA$8.7b - CA$2.6b) (Based on the trailing twelve months to June 2019.)
So, WSP Global has an ROCE of 8.3%.
Check out our latest analysis for WSP Global
Is WSP Global's ROCE Good?
One way to assess ROCE is to compare similar companies. Using our data, WSP Global's ROCE appears to be around the 8.3% average of the Construction industry. Separate from how WSP Global stacks up against its industry, its ROCE in absolute terms is mediocre; relative to the returns on government bonds. Investors may wish to consider higher-performing investments.
You can click on the image below to see (in greater detail) how WSP Global's past growth compares to other companies.
Remember that this metric is backwards looking - it shows what has happened in the past, and does not accurately predict the future. ROCE can be misleading for companies in cyclical industries, with returns looking impressive during the boom times, but very weak during the busts. ROCE is, after all, simply a snap shot of a single year. Since the future is so important for investors, you should check out our free report on analyst forecasts for WSP Global.
What Are Current Liabilities, And How Do They Affect WSP Global's ROCE?
Current liabilities include invoices, such as supplier payments, short-term debt, or a tax bill, that need to be paid within 12 months. The ROCE equation subtracts current liabilities from capital employed, so a company with a lot of current liabilities appears to have less capital employed, and a higher ROCE than otherwise. To check the impact of this, we calculate if a company has high current liabilities relative to its total assets.
WSP Global has total liabilities of CA$2.6b and total assets of CA$8.7b. Therefore its current liabilities are equivalent to approximately 30% of its total assets. WSP Global has a medium level of current liabilities, which would boost its ROCE somewhat.
The Bottom Line On WSP Global's ROCE
With this level of liabilities and a mediocre ROCE, there are potentially better investments out there. Of course, you might also be able to find a better stock than WSP Global. So you may wish to see this free collection of other companies that have grown earnings strongly.
If you are like me, then you will not want to miss this free list of growing companies that insiders are buying.
We aim to bring you long-term focused research analysis driven by fundamental data. Note that our analysis may not factor in the latest price-sensitive company announcements or qualitative material.
If you spot an error that warrants correction, please contact the editor at editorial-team@simplywallst.com. This article by Simply Wall St is general in nature. It does not constitute a recommendation to buy or sell any stock, and does not take account of your objectives, or your financial situation. Simply Wall St has no position in the stocks mentioned. Thank you for reading.
