
 Yahoo Finance
 Does Westshore Terminals Investment Corporation (TSE:WTE) Have A Good P/E Ratio?

Want to participate in a short research study? Help shape the future of investing tools and you could win a $250 gift card!
Today, we'll introduce the concept of the P/E ratio for those who are learning about investing. We'll apply a basic P/E ratio analysis to Westshore Terminals Investment Corporation's (TSE:WTE), to help you decide if the stock is worth further research. Looking at earnings over the last twelve months, Westshore Terminals Investment has a P/E ratio of 11.9. That is equivalent to an earnings yield of about 8.4%.
See our latest analysis for Westshore Terminals Investment
How Do You Calculate A P/E Ratio?
The formula for price to earnings is:
Price to Earnings Ratio = Share Price ÷ Earnings per Share (EPS)
Or for Westshore Terminals Investment:
P/E of 11.9 = CA$22.54 ÷ CA$1.89 (Based on the year to March 2019.)
Is A High Price-to-Earnings Ratio Good?
The higher the P/E ratio, the higher the price tag of a business, relative to its trailing earnings. That isn't necessarily good or bad, but a high P/E implies relatively high expectations of what a company can achieve in the future.
How Growth Rates Impact P/E Ratios
Companies that shrink earnings per share quickly will rapidly decrease the 'E' in the equation. That means even if the current P/E is low, it will increase over time if the share price stays flat. Then, a higher P/E might scare off shareholders, pushing the share price down.
Westshore Terminals Investment increased earnings per share by an impressive 15% over the last twelve months. And its annual EPS growth rate over 5 years is 1.8%. With that performance, you might expect an above average P/E ratio. Unfortunately, earnings per share are down 2.8% a year, over 3 years.
How Does Westshore Terminals Investment's P/E Ratio Compare To Its Peers?
The P/E ratio indicates whether the market has higher or lower expectations of a company. If you look at the image below, you can see Westshore Terminals Investment has a lower P/E than the average (28.7) in the infrastructure industry classification.
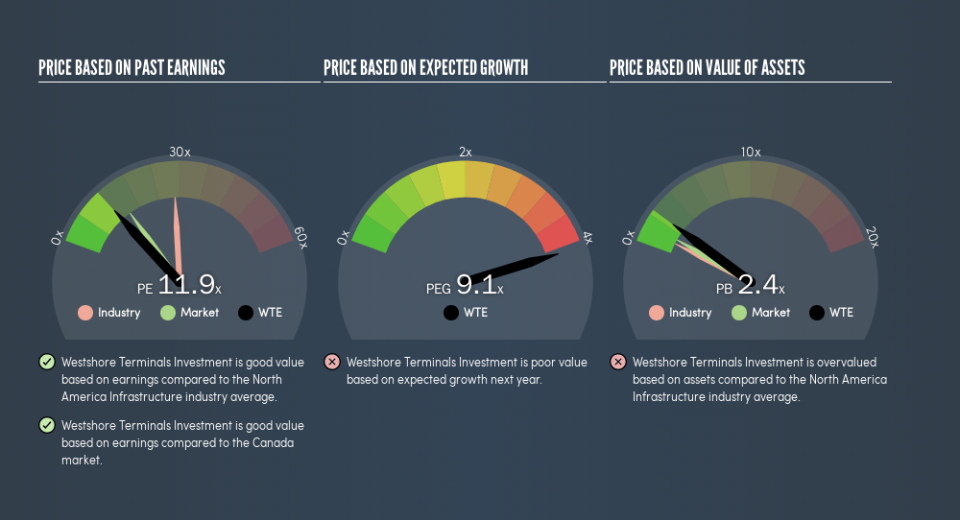
Its relatively low P/E ratio indicates that Westshore Terminals Investment shareholders think it will struggle to do as well as other companies in its industry classification. Since the market seems unimpressed with Westshore Terminals Investment, it's quite possible it could surprise on the upside. You should delve deeper. I like to check if company insiders have been buying or selling.
A Limitation: P/E Ratios Ignore Debt and Cash In The Bank
Don't forget that the P/E ratio considers market capitalization. Thus, the metric does not reflect cash or debt held by the company. The exact same company would hypothetically deserve a higher P/E ratio if it had a strong balance sheet, than if it had a weak one with lots of debt, because a cashed up company can spend on growth.
Spending on growth might be good or bad a few years later, but the point is that the P/E ratio does not account for the option (or lack thereof).
Is Debt Impacting Westshore Terminals Investment's P/E?
Westshore Terminals Investment has net debt worth 17% of its market capitalization. That's enough debt to impact the P/E ratio a little; so keep it in mind if you're comparing it to companies without debt.
The Verdict On Westshore Terminals Investment's P/E Ratio
Westshore Terminals Investment's P/E is 11.9 which is below average (14.7) in the CA market. The company hasn't stretched its balance sheet, and earnings growth was good last year. The low P/E ratio suggests current market expectations are muted, implying these levels of growth will not continue.
Investors should be looking to buy stocks that the market is wrong about. As value investor Benjamin Graham famously said, 'In the short run, the market is a voting machine but in the long run, it is a weighing machine.' So this free report on the analyst consensus forecasts could help you make a master move on this stock.
Of course, you might find a fantastic investment by looking at a few good candidates. So take a peek at this free list of companies with modest (or no) debt, trading on a P/E below 20.
We aim to bring you long-term focused research analysis driven by fundamental data. Note that our analysis may not factor in the latest price-sensitive company announcements or qualitative material.
If you spot an error that warrants correction, please contact the editor at editorial-team@simplywallst.com. This article by Simply Wall St is general in nature. It does not constitute a recommendation to buy or sell any stock, and does not take account of your objectives, or your financial situation. Simply Wall St has no position in the stocks mentioned. Thank you for reading.
