
 Yahoo Finance
 Does Titan International, Inc.'s (NYSE:TWI) CEO Salary Compare Well With Others?

Paul Reitz has been the CEO of Titan International, Inc. (NYSE:TWI) since 2017. This analysis aims first to contrast CEO compensation with other companies that have similar market capitalization. Then we'll look at a snap shot of the business growth. And finally we will reflect on how common stockholders have fared in the last few years, as a secondary measure of performance. This process should give us an idea about how appropriately the CEO is paid.
Check out our latest analysis for Titan International
How Does Paul Reitz's Compensation Compare With Similar Sized Companies?
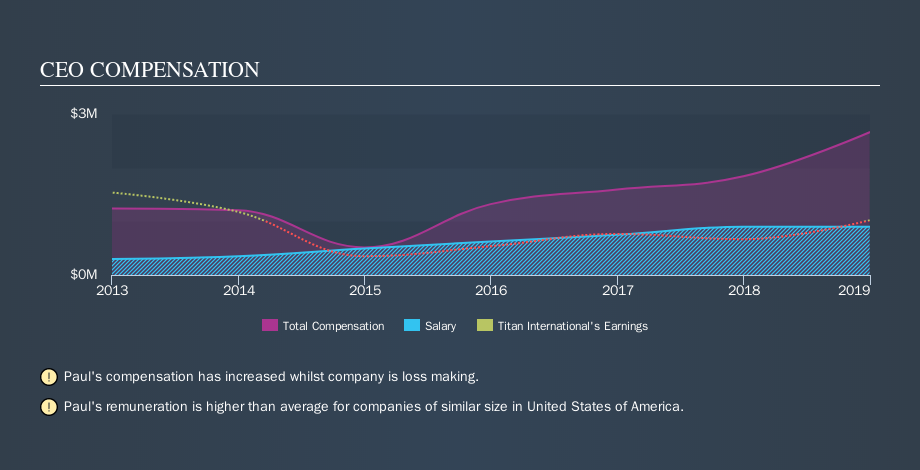
According to our data, Titan International, Inc. has a market capitalization of US$196m, and pays its CEO total annual compensation worth US$2.7m. (This figure is for the year to December 2018). We think total compensation is more important but we note that the CEO salary is lower, at US$900k. We looked at a group of companies with market capitalizations from US$100m to US$400m, and the median CEO total compensation was US$1.2m.
It would therefore appear that Titan International, Inc. pays Paul Reitz more than the median CEO remuneration at companies of a similar size, in the same market. However, this fact alone doesn't mean the remuneration is too high. A closer look at the performance of the underlying business will give us a better idea about whether the pay is particularly generous.
The graphic below shows how CEO compensation at Titan International has changed from year to year.
Is Titan International, Inc. Growing?
Titan International, Inc. has increased its earnings per share (EPS) by an average of 70% a year, over the last three years (using a line of best fit). In the last year, its revenue is down -3.3%.
This demonstrates that the company has been improving recently. A good result. While it would be good to see revenue growth, profits matter more in the end. It could be important to check this free visual depiction of what analysts expect for the future.
Has Titan International, Inc. Been A Good Investment?
With a three year total loss of 64%, Titan International, Inc. would certainly have some dissatisfied shareholders. This suggests it would be unwise for the company to pay the CEO too generously.
In Summary...
We compared total CEO remuneration at Titan International, Inc. with the amount paid at companies with a similar market capitalization. As discussed above, we discovered that the company pays more than the median of that group.
However we must not forget that the EPS growth has been very strong over three years. On the other hand returns to investors over the same period have probably disappointed many. While EPS is positive, we'd say shareholders would want better returns before the CEO is paid much more. CEO compensation is one thing, but it is also interesting to check if the CEO is buying or selling Titan International (free visualization of insider trades).
Arguably, business quality is much more important than CEO compensation levels. So check out this free list of interesting companies, that have HIGH return on equity and low debt.
We aim to bring you long-term focused research analysis driven by fundamental data. Note that our analysis may not factor in the latest price-sensitive company announcements or qualitative material.
If you spot an error that warrants correction, please contact the editor at editorial-team@simplywallst.com. This article by Simply Wall St is general in nature. It does not constitute a recommendation to buy or sell any stock, and does not take account of your objectives, or your financial situation. Simply Wall St has no position in the stocks mentioned. Thank you for reading.