
 Yahoo Finance
 Does Svedbergs i Dalstorp AB (publ)'s (STO:SVED B) Past Performance Indicate A Weaker Future?

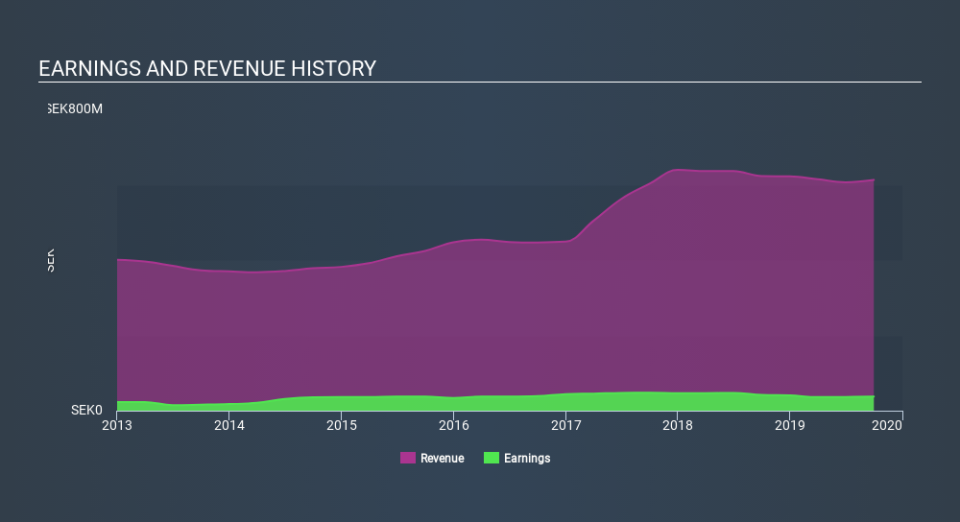
After reading Svedbergs i Dalstorp AB (publ)'s (OM:SVED B) most recent earnings announcement (30 September 2019), I found it useful to look back at how the company has performed in the past and compare this against the latest numbers. As a long term investor, I pay close attention to earnings trend, rather than the figures published at one point in time. I also compare against an industry benchmark to check whether Svedbergs i Dalstorp's performance has been impacted by industry movements. In this article I briefly touch on my key findings.
Check out our latest analysis for Svedbergs i Dalstorp
How Did SVED B's Recent Performance Stack Up Against Its Past?
SVED B's trailing twelve-month earnings (from 30 September 2019) of kr37m has declined by -11% compared to the previous year.
Furthermore, this one-year growth rate has been lower than its average earnings growth rate over the past 5 years of 2.8%, indicating the rate at which SVED B is growing has slowed down. Why is this? Well, let's look at what's occurring with margins and whether the entire industry is experiencing the hit as well.
In terms of returns from investment, Svedbergs i Dalstorp has invested its equity funds well leading to a 22% return on equity (ROE), above the sensible minimum of 20%. Furthermore, its return on assets (ROA) of 7.5% exceeds the SE Building industry of 6.8%, indicating Svedbergs i Dalstorp has used its assets more efficiently. However, its return on capital (ROC), which also accounts for Svedbergs i Dalstorp’s debt level, has declined over the past 3 years from 35% to 15%. This correlates with an increase in debt holding, with debt-to-equity ratio rising from 21% to 148% over the past 5 years.
What does this mean?
Svedbergs i Dalstorp's track record can be a valuable insight into its earnings performance, but it certainly doesn't tell the whole story. Companies that are profitable, but have volatile earnings, can have many factors influencing its business. You should continue to research Svedbergs i Dalstorp to get a more holistic view of the stock by looking at:
Financial Health: Are SVED B’s operations financially sustainable? Balance sheets can be hard to analyze, which is why we’ve done it for you. Check out our financial health checks here.
Valuation: What is SVED B worth today? Is the stock undervalued, even when its growth outlook is factored into its intrinsic value? The intrinsic value infographic in our free research report helps visualize whether SVED B is currently mispriced by the market.
Other High-Performing Stocks: Are there other stocks that provide better prospects with proven track records? Explore our free list of these great stocks here.
NB: Figures in this article are calculated using data from the trailing twelve months from 30 September 2019. This may not be consistent with full year annual report figures.
If you spot an error that warrants correction, please contact the editor at editorial-team@simplywallst.com. This article by Simply Wall St is general in nature. It does not constitute a recommendation to buy or sell any stock, and does not take account of your objectives, or your financial situation. Simply Wall St has no position in the stocks mentioned.
We aim to bring you long-term focused research analysis driven by fundamental data. Note that our analysis may not factor in the latest price-sensitive company announcements or qualitative material. Thank you for reading.
