
 Yahoo Finance
 How Does Sunrun's (NASDAQ:RUN) P/E Compare To Its Industry, After The Share Price Drop?

To the annoyance of some shareholders, Sunrun (NASDAQ:RUN) shares are down a considerable 59% in the last month. Indeed the recent decline has arguably caused some bitterness for shareholders who have held through the 37% drop over twelve months.
Assuming nothing else has changed, a lower share price makes a stock more attractive to potential buyers. In the long term, share prices tend to follow earnings per share, but in the short term prices bounce around in response to short term factors (which are not always obvious). The implication here is that long term investors have an opportunity when expectations of a company are too low. Perhaps the simplest way to get a read on investors' expectations of a business is to look at its Price to Earnings Ratio (PE Ratio). Investors have optimistic expectations of companies with higher P/E ratios, compared to companies with lower P/E ratios.
Check out our latest analysis for Sunrun
How Does Sunrun's P/E Ratio Compare To Its Peers?
We can tell from its P/E ratio of 39.87 that there is some investor optimism about Sunrun. As you can see below, Sunrun has a higher P/E than the average company (13.6) in the electrical industry.
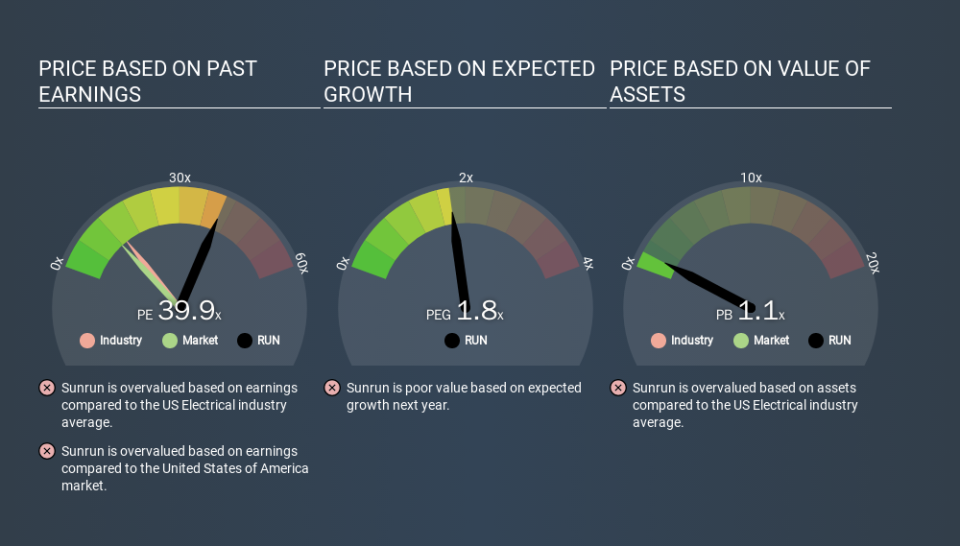
Its relatively high P/E ratio indicates that Sunrun shareholders think it will perform better than other companies in its industry classification. Shareholders are clearly optimistic, but the future is always uncertain. So further research is always essential. I often monitor director buying and selling.
How Growth Rates Impact P/E Ratios
If earnings fall then in the future the 'E' will be lower. That means unless the share price falls, the P/E will increase in a few years. Then, a higher P/E might scare off shareholders, pushing the share price down.
Sunrun saw earnings per share decrease by 6.6% last year. And over the longer term (3 years) earnings per share have decreased 32% annually. So you wouldn't expect a very high P/E.
A Limitation: P/E Ratios Ignore Debt and Cash In The Bank
The 'Price' in P/E reflects the market capitalization of the company. So it won't reflect the advantage of cash, or disadvantage of debt. Theoretically, a business can improve its earnings (and produce a lower P/E in the future) by investing in growth. That means taking on debt (or spending its cash).
While growth expenditure doesn't always pay off, the point is that it is a good option to have; but one that the P/E ratio ignores.
So What Does Sunrun's Balance Sheet Tell Us?
Sunrun's net debt is considerable, at 205% of its market cap. This is a relatively high level of debt, so the stock probably deserves a relatively low P/E ratio. Keep that in mind when comparing it to other companies.
The Verdict On Sunrun's P/E Ratio
Sunrun trades on a P/E ratio of 39.9, which is multiples above its market average of 11.5. With meaningful debt and a lack of recent earnings growth, the market has high expectations that the business will earn more in the future. What can be absolutely certain is that the market has become significantly less optimistic about Sunrun over the last month, with the P/E ratio falling from 97.0 back then to 39.9 today. For those who don't like to trade against momentum, that could be a warning sign, but a contrarian investor might want to take a closer look.
Investors should be looking to buy stocks that the market is wrong about. As value investor Benjamin Graham famously said, 'In the short run, the market is a voting machine but in the long run, it is a weighing machine. So this free visualization of the analyst consensus on future earnings could help you make the right decision about whether to buy, sell, or hold.
Of course, you might find a fantastic investment by looking at a few good candidates. So take a peek at this free list of companies with modest (or no) debt, trading on a P/E below 20.
If you spot an error that warrants correction, please contact the editor at editorial-team@simplywallst.com. This article by Simply Wall St is general in nature. It does not constitute a recommendation to buy or sell any stock, and does not take account of your objectives, or your financial situation. Simply Wall St has no position in the stocks mentioned.
We aim to bring you long-term focused research analysis driven by fundamental data. Note that our analysis may not factor in the latest price-sensitive company announcements or qualitative material. Thank you for reading.
