
 Yahoo Finance
 What does Sprouts Farmers Market, Inc.’s (NASDAQ:SFM) Balance Sheet Tell Us About Its Future?

Small-caps and large-caps are wildly popular among investors; however, mid-cap stocks, such as Sprouts Farmers Market, Inc. (NASDAQ:SFM) with a market-capitalization of US$3.0b, rarely draw their attention. Despite this, commonly overlooked mid-caps have historically produced better risk-adjusted returns than their small and large-cap counterparts. Let’s take a look at SFM’s debt concentration and assess their financial liquidity to get an idea of their ability to fund strategic acquisitions and grow through cyclical pressures. Don’t forget that this is a general and concentrated examination of Sprouts Farmers Market’s financial health, so you should conduct further analysis into SFM here.
Check out our latest analysis for Sprouts Farmers Market
Want to help shape the future of investing tools and platforms? Take the survey and be part of one of the most advanced studies of stock market investors to date.
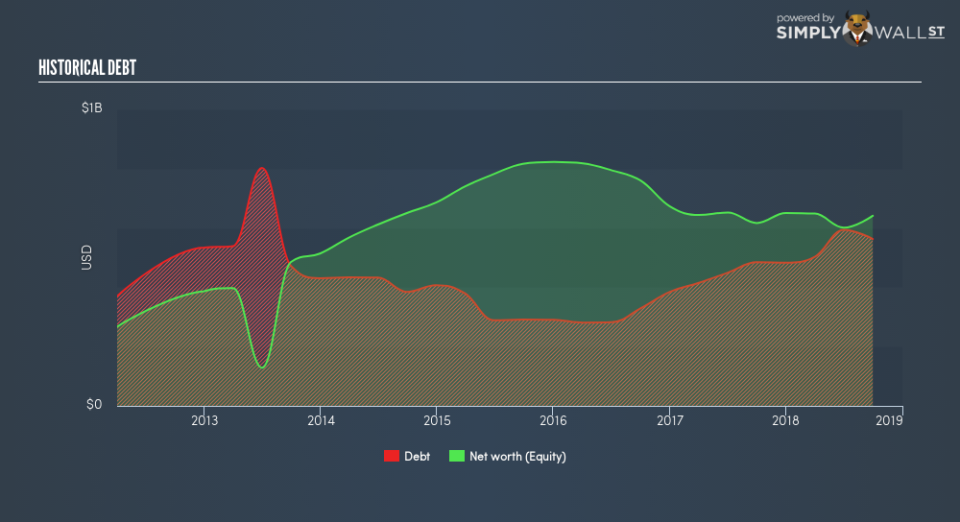
How does SFM’s operating cash flow stack up against its debt?
SFM’s debt levels surged from US$485m to US$563m over the last 12 months , which accounts for long term debt. With this rise in debt, SFM currently has US$17m remaining in cash and short-term investments , ready to deploy into the business. Additionally, SFM has produced cash from operations of US$286m over the same time period, leading to an operating cash to total debt ratio of 51%, signalling that SFM’s debt is appropriately covered by operating cash. This ratio can also be interpreted as a measure of efficiency as an alternative to return on assets. In SFM’s case, it is able to generate 0.51x cash from its debt capital.
Can SFM meet its short-term obligations with the cash in hand?
Looking at SFM’s US$297m in current liabilities, the company has been able to meet these obligations given the level of current assets of US$342m, with a current ratio of 1.15x. Usually, for Consumer Retailing companies, this is a suitable ratio since there is a bit of a cash buffer without leaving too much capital in a low-return environment.
Can SFM service its debt comfortably?
With a debt-to-equity ratio of 88%, SFM can be considered as an above-average leveraged company. This is not unusual for mid-caps as debt tends to be a cheaper and faster source of funding for some businesses. No matter how high the company’s debt, if it can easily cover the interest payments, it’s considered to be efficient with its use of excess leverage. A company generating earnings after interest and tax at least three times its net interest payments is considered financially sound. In SFM’s case, the ratio of 8.99x suggests that interest is appropriately covered, which means that lenders may be less hesitant to lend out more funding as SFM’s high interest coverage is seen as responsible and safe practice.
Next Steps:
SFM’s high cash coverage means that, although its debt levels are high, the company is able to utilise its borrowings efficiently in order to generate cash flow. This may mean this is an optimal capital structure for the business, given that it is also meeting its short-term commitment. This is only a rough assessment of financial health, and I’m sure SFM has company-specific issues impacting its capital structure decisions. I suggest you continue to research Sprouts Farmers Market to get a more holistic view of the mid-cap by looking at:
Future Outlook: What are well-informed industry analysts predicting for SFM’s future growth? Take a look at our free research report of analyst consensus for SFM’s outlook.
Valuation: What is SFM worth today? Is the stock undervalued, even when its growth outlook is factored into its intrinsic value? The intrinsic value infographic in our free research report helps visualize whether SFM is currently mispriced by the market.
Other High-Performing Stocks: Are there other stocks that provide better prospects with proven track records? Explore our free list of these great stocks here.
To help readers see past the short term volatility of the financial market, we aim to bring you a long-term focused research analysis purely driven by fundamental data. Note that our analysis does not factor in the latest price-sensitive company announcements.
The author is an independent contributor and at the time of publication had no position in the stocks mentioned. For errors that warrant correction please contact the editor at editorial-team@simplywallst.com.
