
 Yahoo Finance
 Does Sportscene Group Inc (CVE:SPS.A) Have A Place In Your Portfolio?

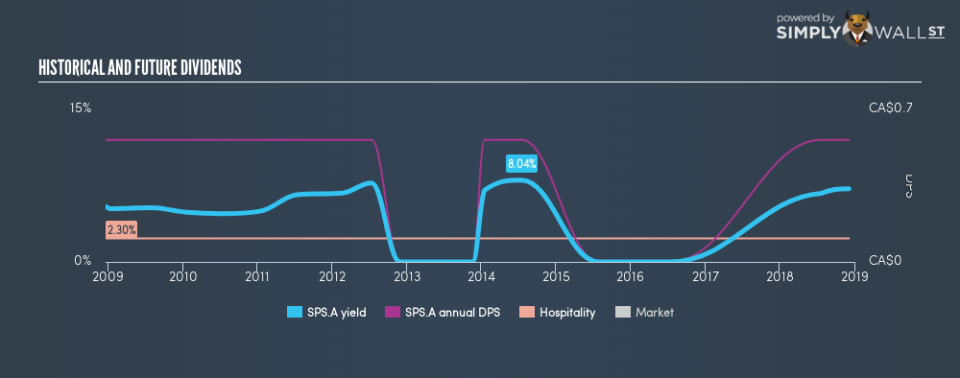
Dividends can be underrated but they form a large part of investment returns, playing an important role in compounding returns in the long run. Historically, Sportscene Group Inc (CVE:SPS.A) has been paying a dividend to shareholders. Today it yields 7.2%. Does Sportscene Group tick all the boxes of a great dividend stock? Below, I’ll take you through my analysis.
View our latest analysis for Sportscene Group
5 questions to ask before buying a dividend stock
When assessing a stock as a potential addition to my dividend Portfolio, I look at these five areas:
Is it paying an annual yield above 75% of dividend payers?
Has its dividend been stable over the past (i.e. no missed payments or significant payout cuts)?
Has dividend per share risen in the past couple of years?
Is its earnings sufficient to payout dividend at the current rate?
Based on future earnings growth, will it be able to continue to payout dividend at the current rate?
How well does Sportscene Group fit our criteria?
Sportscene Group has a trailing twelve-month payout ratio of 41%, which means that the dividend is covered by earnings. Furthermore, analysts have not forecasted a dividends per share for the future, which makes it hard to determine the yield shareholders should expect, and whether the current payout is sustainable, moving forward.
When assessing the forecast sustainability of a dividend it is also worth considering the cash flow of the business. A company with strong cash flow, relative to earnings, can sometimes sustain a high pay out ratio.
If there’s one type of stock you want to be reliable, it’s dividend stocks and their stable income-generating ability. SPS.A investors will be well aware the dividend payments are lower today than they were 10 years ago, although the payments have at least been steady. However, income investors that value stability over growth may still find SPS.A appealing.
Compared to its peers, Sportscene Group produces a yield of 7.2%, which is high for Hospitality stocks.
Next Steps:
Taking into account the dividend metrics, Sportscene Group ticks most of the boxes as a strong dividend investment, putting it in my list of top dividend payers. Given that this is purely a dividend analysis, you should always research extensively before deciding whether or not a stock is an appropriate investment for you. I always recommend analysing the company’s fundamentals and underlying business before making an investment decision. Below, I’ve compiled three essential aspects you should look at:
Historical Performance: What has SPS.A’s returns been like over the past? Go into more detail in the past track record analysis and take a look at the free visual representations of our analysis for more clarity.
Management Team: An experienced management team on the helm increases our confidence in the business – take a look at who sits on Sportscene Group’s board and the CEO’s back ground.
Other Dividend Rockstars: Are there better dividend payers with stronger fundamentals out there? Check out our free list of these great stocks here.
To help readers see past the short term volatility of the financial market, we aim to bring you a long-term focused research analysis purely driven by fundamental data. Note that our analysis does not factor in the latest price-sensitive company announcements.
The author is an independent contributor and at the time of publication had no position in the stocks mentioned. For errors that warrant correction please contact the editor at editorial-team@simplywallst.com.
