
 Yahoo Finance
 How Does Smart Sand's (NASDAQ:SND) P/E Compare To Its Industry, After The Share Price Drop?

To the annoyance of some shareholders, Smart Sand (NASDAQ:SND) shares are down a considerable 44% in the last month. Given the 62% drop over the last year, some shareholders might be worried that they have become bagholders. For those wondering, a bagholder is someone who keeps holding a losing stock indefinitely, without taking the time to consider its prospects carefully, going forward.
All else being equal, a share price drop should make a stock more attractive to potential investors. While the market sentiment towards a stock is very changeable, in the long run, the share price will tend to move in the same direction as earnings per share. The implication here is that long term investors have an opportunity when expectations of a company are too low. One way to gauge market expectations of a stock is to look at its Price to Earnings Ratio (PE Ratio). A high P/E ratio means that investors have a high expectation about future growth, while a low P/E ratio means they have low expectations about future growth.
View our latest analysis for Smart Sand
How Does Smart Sand's P/E Ratio Compare To Its Peers?
Smart Sand's P/E of 1.37 indicates relatively low sentiment towards the stock. The image below shows that Smart Sand has a lower P/E than the average (10.0) P/E for companies in the energy services industry.
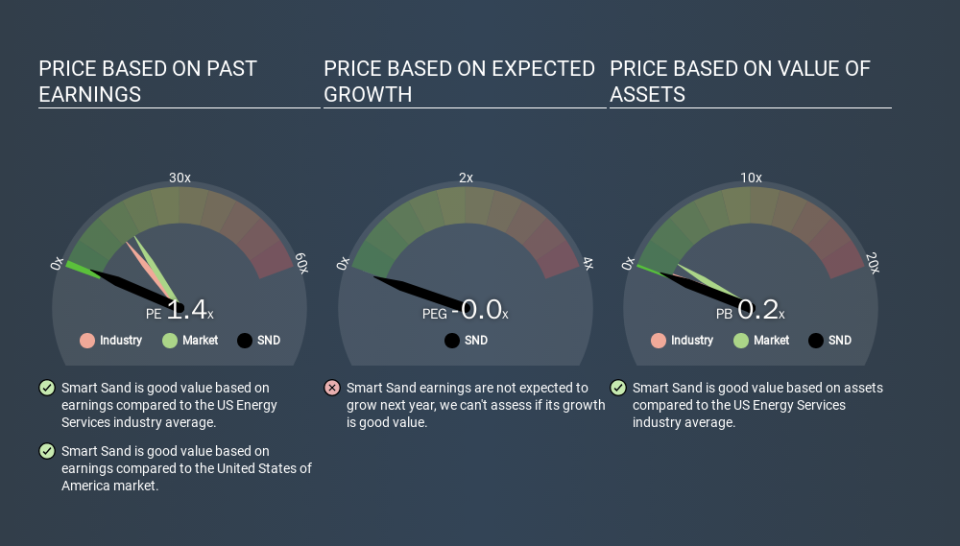
This suggests that market participants think Smart Sand will underperform other companies in its industry. Since the market seems unimpressed with Smart Sand, it's quite possible it could surprise on the upside. It is arguably worth checking if insiders are buying shares, because that might imply they believe the stock is undervalued.
How Growth Rates Impact P/E Ratios
Probably the most important factor in determining what P/E a company trades on is the earnings growth. When earnings grow, the 'E' increases, over time. That means even if the current P/E is high, it will reduce over time if the share price stays flat. And as that P/E ratio drops, the company will look cheap, unless its share price increases.
In the last year, Smart Sand grew EPS like Taylor Swift grew her fan base back in 2010; the 70% gain was both fast and well deserved. The sweetener is that the annual five year growth rate of 18% is also impressive. With that kind of growth rate we would generally expect a high P/E ratio.
A Limitation: P/E Ratios Ignore Debt and Cash In The Bank
One drawback of using a P/E ratio is that it considers market capitalization, but not the balance sheet. In other words, it does not consider any debt or cash that the company may have on the balance sheet. Hypothetically, a company could reduce its future P/E ratio by spending its cash (or taking on debt) to achieve higher earnings.
Such expenditure might be good or bad, in the long term, but the point here is that the balance sheet is not reflected by this ratio.
So What Does Smart Sand's Balance Sheet Tell Us?
Smart Sand's net debt is 67% of its market cap. This is a reasonably significant level of debt -- all else being equal you'd expect a much lower P/E than if it had net cash.
The Verdict On Smart Sand's P/E Ratio
Smart Sand's P/E is 1.4 which is below average (15.1) in the US market. While the EPS growth last year was strong, the significant debt levels reduce the number of options available to management. The low P/E ratio suggests current market expectations are muted, implying these levels of growth will not continue. Given Smart Sand's P/E ratio has declined from 2.4 to 1.4 in the last month, we know for sure that the market is more worried about the business today, than it was back then. For those who prefer invest in growth, this stock apparently offers limited promise, but the deep value investors may find the pessimism around this stock enticing.
Investors have an opportunity when market expectations about a stock are wrong. If it is underestimating a company, investors can make money by buying and holding the shares until the market corrects itself. So this free visualization of the analyst consensus on future earnings could help you make the right decision about whether to buy, sell, or hold.
You might be able to find a better buy than Smart Sand. If you want a selection of possible winners, check out this free list of interesting companies that trade on a P/E below 20 (but have proven they can grow earnings).
If you spot an error that warrants correction, please contact the editor at editorial-team@simplywallst.com. This article by Simply Wall St is general in nature. It does not constitute a recommendation to buy or sell any stock, and does not take account of your objectives, or your financial situation. Simply Wall St has no position in the stocks mentioned.
We aim to bring you long-term focused research analysis driven by fundamental data. Note that our analysis may not factor in the latest price-sensitive company announcements or qualitative material. Thank you for reading.
