
 Yahoo Finance
 Does The Sernova Corp. (CVE:SVA) Share Price Tend To Follow The Market?

If you're interested in Sernova Corp. (CVE:SVA), then you might want to consider its beta (a measure of share price volatility) in order to understand how the stock could impact your portfolio. Volatility is considered to be a measure of risk in modern finance theory. Investors may think of volatility as falling into two main categories. First, we have company specific volatility, which is the price gyrations of an individual stock. Holding at least 8 stocks can reduce this kind of risk across a portfolio. The other type, which cannot be diversified away, is the volatility of the entire market. Every stock in the market is exposed to this volatility, which is linked to the fact that stocks prices are correlated in an efficient market.
Some stocks mimic the volatility of the market quite closely, while others demonstrate muted, exagerrated or uncorrelated price movements. Beta is a widely used metric to measure a stock's exposure to market risk (volatility). Before we go on, it's worth noting that Warren Buffett pointed out in his 2014 letter to shareholders that 'volatility is far from synonymous with risk.' Having said that, beta can still be rather useful. The first thing to understand about beta is that the beta of the overall market is one. A stock with a beta greater than one is more sensitive to broader market movements than a stock with a beta of less than one.
Check out our latest analysis for Sernova
What SVA's beta value tells investors
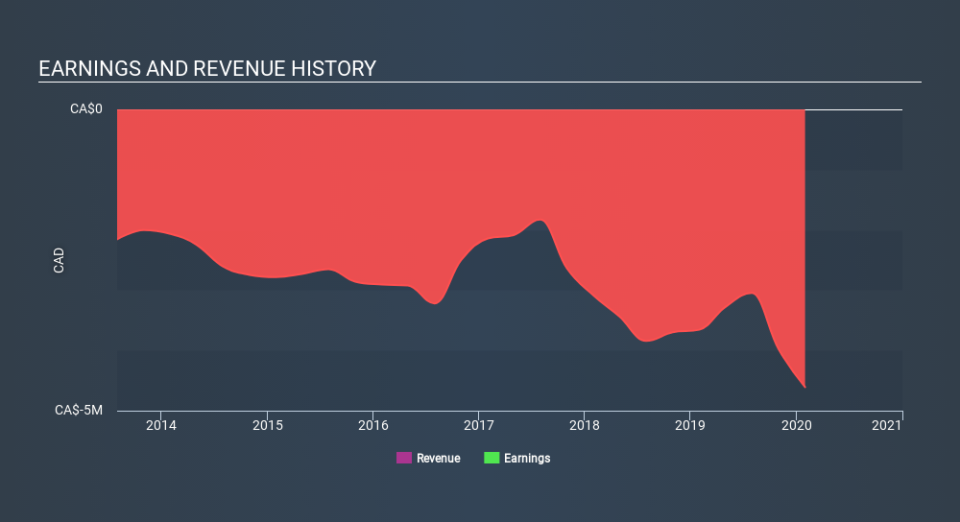
Given this level of beta, if the future looks like the past, we could therefore consider it likely that the stock price will experience share price volatility that is roughly similar to the overall market. Beta is worth considering, but it's also important to consider whether Sernova is growing earnings and revenue. You can take a look for yourself, below.
Could SVA's size cause it to be more volatile?
Sernova is a rather small company. It has a market capitalisation of CA$35m, which means it is probably under the radar of most investors. Companies this small are usually more volatile than the market, whether or not that volatility is correlated. Therefore, it's a bit surprising to see that this stock has a beta value so close to the overall market.
What this means for you:
Since Sernova has a beta close to one, it will probably show a positive return when the market is moving up, based on history. If you're trying to generate better returns than the market, it would be worth thinking about other metrics such as cashflows, dividends and revenue growth might be a more useful guide to the future. This article aims to educate investors about beta values, but it's well worth looking at important company-specific fundamentals such as Sernova’s financial health and performance track record. I urge you to continue your research by taking a look at the following:
Future Outlook: What are well-informed industry analysts predicting for SVA’s future growth? Take a look at our free research report of analyst consensus for SVA’s outlook.
Past Track Record: Has SVA been consistently performing well irrespective of the ups and downs in the market? Go into more detail in the past performance analysis and take a look at the free visual representations of SVA's historicals for more clarity.
Other Interesting Stocks: It's worth checking to see how SVA measures up against other companies on valuation. You could start with this free list of prospective options.
Love or hate this article? Concerned about the content? Get in touch with us directly. Alternatively, email editorial-team@simplywallst.com.
This article by Simply Wall St is general in nature. It does not constitute a recommendation to buy or sell any stock, and does not take account of your objectives, or your financial situation. We aim to bring you long-term focused analysis driven by fundamental data. Note that our analysis may not factor in the latest price-sensitive company announcements or qualitative material. Simply Wall St has no position in any stocks mentioned. Thank you for reading.
