
 Yahoo Finance
 How Does SergeFerrari Group's (EPA:SEFER) P/E Compare To Its Industry, After The Share Price Drop?

To the annoyance of some shareholders, SergeFerrari Group (EPA:SEFER) shares are down a considerable 32% in the last month. The recent drop has obliterated the annual return, with the share price now down 16% over that longer period.
Assuming nothing else has changed, a lower share price makes a stock more attractive to potential buyers. While the market sentiment towards a stock is very changeable, in the long run, the share price will tend to move in the same direction as earnings per share. The implication here is that long term investors have an opportunity when expectations of a company are too low. One way to gauge market expectations of a stock is to look at its Price to Earnings Ratio (PE Ratio). A high P/E ratio means that investors have a high expectation about future growth, while a low P/E ratio means they have low expectations about future growth.
See our latest analysis for SergeFerrari Group
Does SergeFerrari Group Have A Relatively High Or Low P/E For Its Industry?
SergeFerrari Group's P/E of 10.24 indicates relatively low sentiment towards the stock. If you look at the image below, you can see SergeFerrari Group has a lower P/E than the average (15.6) in the chemicals industry classification.
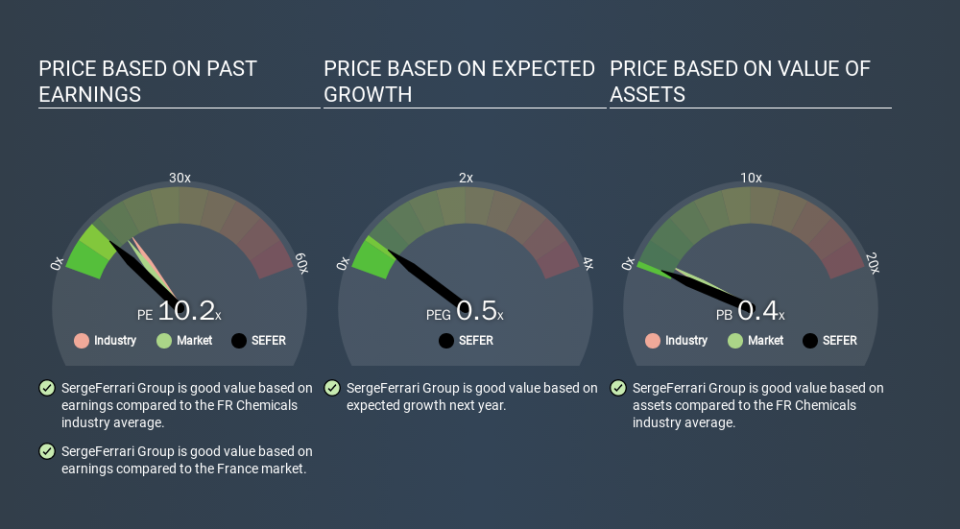
SergeFerrari Group's P/E tells us that market participants think it will not fare as well as its peers in the same industry. Since the market seems unimpressed with SergeFerrari Group, it's quite possible it could surprise on the upside. It is arguably worth checking if insiders are buying shares, because that might imply they believe the stock is undervalued.
How Growth Rates Impact P/E Ratios
Generally speaking the rate of earnings growth has a profound impact on a company's P/E multiple. When earnings grow, the 'E' increases, over time. That means unless the share price increases, the P/E will reduce in a few years. A lower P/E should indicate the stock is cheap relative to others -- and that may attract buyers.
SergeFerrari Group's earnings made like a rocket, taking off 163% last year. Having said that, the average EPS growth over the last three years wasn't so good, coming in at 5.4%.
Remember: P/E Ratios Don't Consider The Balance Sheet
One drawback of using a P/E ratio is that it considers market capitalization, but not the balance sheet. In other words, it does not consider any debt or cash that the company may have on the balance sheet. In theory, a company can lower its future P/E ratio by using cash or debt to invest in growth.
Such spending might be good or bad, overall, but the key point here is that you need to look at debt to understand the P/E ratio in context.
Is Debt Impacting SergeFerrari Group's P/E?
With net cash of €5.2m, SergeFerrari Group has a very strong balance sheet, which may be important for its business. Having said that, at 10% of its market capitalization the cash hoard would contribute towards a higher P/E ratio.
The Bottom Line On SergeFerrari Group's P/E Ratio
SergeFerrari Group's P/E is 10.2 which is below average (14.1) in the FR market. It grew its EPS nicely over the last year, and the healthy balance sheet implies there is more potential for growth. The below average P/E ratio suggests that market participants don't believe the strong growth will continue. Because analysts are predicting more growth in the future, one might have expected to see a higher P/E ratio. You can take a closer look at the fundamentals, here. Given SergeFerrari Group's P/E ratio has declined from 15.0 to 10.2 in the last month, we know for sure that the market is less confident about the business today, than it was back then. For those who prefer to invest with the flow of momentum, that might be a bad sign, but for a contrarian, it may signal opportunity.
Investors should be looking to buy stocks that the market is wrong about. If the reality for a company is not as bad as the P/E ratio indicates, then the share price should increase as the market realizes this. So this free report on the analyst consensus forecasts could help you make a master move on this stock.
But note: SergeFerrari Group may not be the best stock to buy. So take a peek at this free list of interesting companies with strong recent earnings growth (and a P/E ratio below 20).
If you spot an error that warrants correction, please contact the editor at editorial-team@simplywallst.com. This article by Simply Wall St is general in nature. It does not constitute a recommendation to buy or sell any stock, and does not take account of your objectives, or your financial situation. Simply Wall St has no position in the stocks mentioned.
We aim to bring you long-term focused research analysis driven by fundamental data. Note that our analysis may not factor in the latest price-sensitive company announcements or qualitative material. Thank you for reading.
