
 Yahoo Finance
 What Does SAP SE's (FRA:SAP) P/E Ratio Tell You?

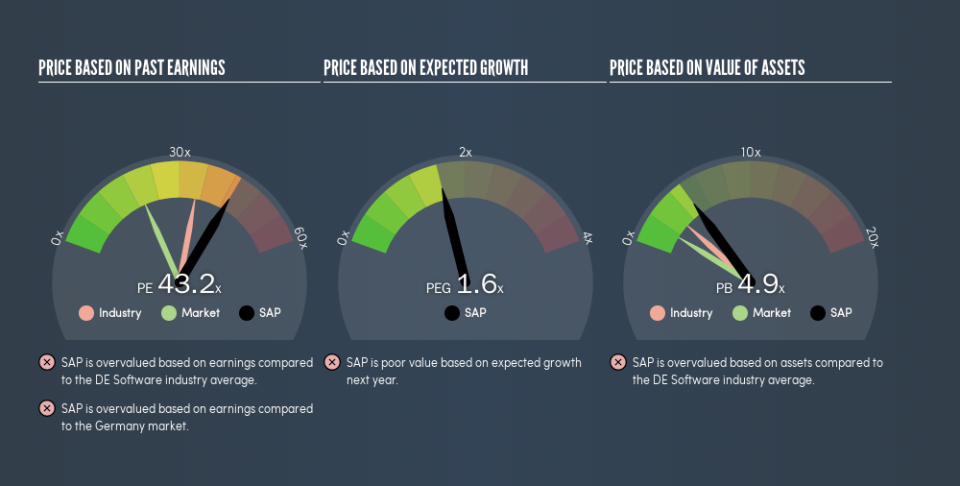
Today, we'll introduce the concept of the P/E ratio for those who are learning about investing. We'll show how you can use SAP SE's (FRA:SAP) P/E ratio to inform your assessment of the investment opportunity. What is SAP's P/E ratio? Well, based on the last twelve months it is 43.18. That is equivalent to an earnings yield of about 2.3%.
View our latest analysis for SAP
How Do I Calculate SAP's Price To Earnings Ratio?
The formula for P/E is:
Price to Earnings Ratio = Share Price ÷ Earnings per Share (EPS)
Or for SAP:
P/E of 43.18 = €112.54 ÷ €2.61 (Based on the trailing twelve months to June 2019.)
Is A High Price-to-Earnings Ratio Good?
A higher P/E ratio means that buyers have to pay a higher price for each €1 the company has earned over the last year. That isn't a good or a bad thing on its own, but a high P/E means that buyers have a higher opinion of the business's prospects, relative to stocks with a lower P/E.
How Does SAP's P/E Ratio Compare To Its Peers?
The P/E ratio indicates whether the market has higher or lower expectations of a company. You can see in the image below that the average P/E (35.1) for companies in the software industry is lower than SAP's P/E.
That means that the market expects SAP will outperform other companies in its industry. The market is optimistic about the future, but that doesn't guarantee future growth. So investors should delve deeper. I like to check if company insiders have been buying or selling.
How Growth Rates Impact P/E Ratios
If earnings fall then in the future the 'E' will be lower. Therefore, even if you pay a low multiple of earnings now, that multiple will become higher in the future. So while a stock may look cheap based on past earnings, it could be expensive based on future earnings.
SAP's earnings per share fell by 27% in the last twelve months. And EPS is down 4.3% a year, over the last 3 years. This could justify a low P/E.
Remember: P/E Ratios Don't Consider The Balance Sheet
The 'Price' in P/E reflects the market capitalization of the company. In other words, it does not consider any debt or cash that the company may have on the balance sheet. Theoretically, a business can improve its earnings (and produce a lower P/E in the future) by investing in growth. That means taking on debt (or spending its cash).
Such spending might be good or bad, overall, but the key point here is that you need to look at debt to understand the P/E ratio in context.
SAP's Balance Sheet
Since SAP holds net cash of €4.1b, it can spend on growth, justifying a higher P/E ratio than otherwise.
The Verdict On SAP's P/E Ratio
SAP's P/E is 43.2 which is above average (19.7) in its market. Falling earnings per share is probably keeping traditional value investors away, but the healthy balance sheet means the company retains potential for future growth. If fails to eventuate, the current high P/E could prove to be temporary, as the share price falls.
Investors should be looking to buy stocks that the market is wrong about. People often underestimate remarkable growth -- so investors can make money when fast growth is not fully appreciated. So this free visualization of the analyst consensus on future earnings could help you make the right decision about whether to buy, sell, or hold.
Of course you might be able to find a better stock than SAP. So you may wish to see this free collection of other companies that have grown earnings strongly.
We aim to bring you long-term focused research analysis driven by fundamental data. Note that our analysis may not factor in the latest price-sensitive company announcements or qualitative material.
If you spot an error that warrants correction, please contact the editor at editorial-team@simplywallst.com. This article by Simply Wall St is general in nature. It does not constitute a recommendation to buy or sell any stock, and does not take account of your objectives, or your financial situation. Simply Wall St has no position in the stocks mentioned. Thank you for reading.
