
 Yahoo Finance
 Does The Sanmina Corporation (NASDAQ:SANM) Share Price Tend To Follow The Market?

If you're interested in Sanmina Corporation (NASDAQ:SANM), then you might want to consider its beta (a measure of share price volatility) in order to understand how the stock could impact your portfolio. Volatility is considered to be a measure of risk in modern finance theory. Investors may think of volatility as falling into two main categories. The first category is company specific volatility. This can be dealt with by limiting your exposure to any particular stock. The second type is the broader market volatility, which you cannot diversify away, since it arises from macroeconomic factors which directly affects all the stocks on the market.
Some stocks are more sensitive to general market forces than others. Beta is a widely used metric to measure a stock's exposure to market risk (volatility). Before we go on, it's worth noting that Warren Buffett pointed out in his 2014 letter to shareholders that 'volatility is far from synonymous with risk.' Having said that, beta can still be rather useful. The first thing to understand about beta is that the beta of the overall market is one. A stock with a beta greater than one is more sensitive to broader market movements than a stock with a beta of less than one.
Want to participate in a short research study? Help shape the future of investing tools and you could win a $250 gift card!
See our latest analysis for Sanmina
What we can learn from SANM's beta value
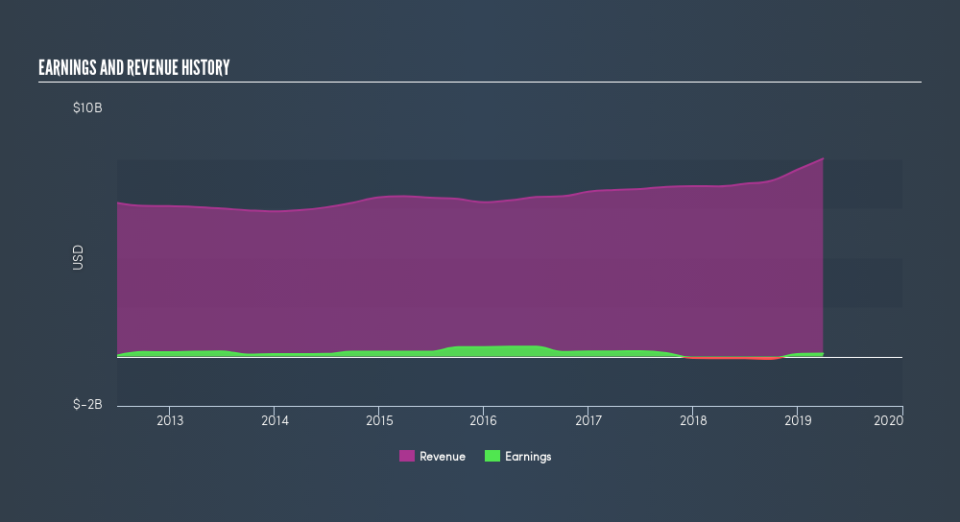
Looking at the last five years, Sanmina has a beta of 1.11. The fact that this is well above 1 indicates that its share price movements have shown sensitivity to overall market volatility. If this beta value holds true in the future, Sanmina shares are likely to rise more than the market when the market is going up, but fall faster when the market is going down. Many would argue that beta is useful in position sizing, but fundamental metrics such as revenue and earnings are more important overall. You can see Sanmina's revenue and earnings in the image below.
Does SANM's size influence the expected beta?
With a market capitalisation of US$2.2b, Sanmina is a pretty big company, even by global standards. It is quite likely well known to very many investors. It takes a lot of money to influence the share price of large companies like this one. That makes it interesting to note that its share price has a history of sensitivity to market volatility. There might be some aspect of the business that means profits are leveraged to the economic cycle.
What this means for you:
Beta only tells us that the Sanmina share price is sensitive to broader market movements. This could indicate that it is a high growth company, or is heavily influenced by sentiment because it is speculative. Alternatively, it could have operating leverage in its business model. Ultimately, beta is an interesting metric, but there's plenty more to learn. In order to fully understand whether SANM is a good investment for you, we also need to consider important company-specific fundamentals such as Sanmina’s financial health and performance track record. I urge you to continue your research by taking a look at the following:
Future Outlook: What are well-informed industry analysts predicting for SANM’s future growth? Take a look at our free research report of analyst consensus for SANM’s outlook.
Past Track Record: Has SANM been consistently performing well irrespective of the ups and downs in the market? Go into more detail in the past performance analysis and take a look at the free visual representations of SANM's historicals for more clarity.
Other Interesting Stocks: It's worth checking to see how SANM measures up against other companies on valuation. You could start with this free list of prospective options.
We aim to bring you long-term focused research analysis driven by fundamental data. Note that our analysis may not factor in the latest price-sensitive company announcements or qualitative material.
If you spot an error that warrants correction, please contact the editor at editorial-team@simplywallst.com. This article by Simply Wall St is general in nature. It does not constitute a recommendation to buy or sell any stock, and does not take account of your objectives, or your financial situation. Simply Wall St has no position in the stocks mentioned. Thank you for reading.
